
Most businesses focus on design perfection during installation. But the real problem shows up three months later when your brand's visual identity starts drifting across different locations. You installed identical signs. Now they look different. Why?
Custom business neon signs fail not because they break immediately, but because they deteriorate in ways you cannot see during testing. The core issue is material degradation under UV exposure, thermal stress accumulation in curved sections, and voltage drift causing brightness inconsistency. Professional systems control visual decay rate, not just initial appearance.
I have been working with multinational brands for over eight years. I have seen perfect installations turn into brand liability within months. The pattern is always the same. You approve the design. You verify the samples. You complete installation. Everything looks flawless. Then three months pass. Store managers start sending photos. The logo in Location A looks brighter than Location B. The curve in the letter "S" appears dimmer. The white no longer matches across regions. This is not random failure. This is systematic visual drift.
Why Does Your Custom Neon Sign Look Different After Installation?
You installed identical custom business neon signs in ten locations. Six months later, they no longer look identical. What went wrong? The answer is not in the installation process. It is in the system design phase.
Custom neon signs are not static products. They are dynamic material systems constantly reacting to UV radiation, thermal cycling, mechanical stress, and voltage fluctuation. Quality differences emerge not during testing, but during long-term exposure. Professional manufacturing controls degradation velocity, not just initial specifications.
We delivered a retail chain project last year. Twenty-three locations. Identical logo. Same design file. Same installation team. At month four, corporate headquarters received complaints. The neon signs looked different. Not broken. Just different. We conducted site inspections. The technical findings revealed the truth. Some units showed 8% yellowing in silicone extrusion. Others showed 3%. Some had visible brightness drop in curved sections. Others maintained uniformity. The root cause was not installation error. It was material batch inconsistency combined with environmental stress variation.
I learned a fundamental principle from this project. Custom business neon signs fail when manufacturers treat them as "lighting products" instead of "time-dependent material systems." The silicone you choose today determines yellowing rate twelve months from now. The copper foil thickness you specify controls fatigue crack propagation in curved geometries. The LED binning strategy defines color drift across your entire brand network. These decisions happen during design phase. The consequences appear during operation phase.
Here is what actually determines system longevity. First, silicone molecular weight and UV stabilizer concentration control yellowing velocity. Low-grade silicone shows 15-20% transmittance loss within eight months under continuous UV exposure. High-molecular silicone with proper UV inhibitors maintains 95%+ transmittance over three years. Second, extrusion wall thickness uniformity affects mechanical stress distribution. Variations above 0.2mm create stress concentration points that accelerate LED junction failure. Third, copper foil thickness relative to bending radius determines fatigue life. Insufficient thickness leads to micro-cracks that increase electrical resistance and create localized heat buildup.
The industry talks about IP ratings and lumen output. I focus on degradation kinetics. How fast does your system lose visual consistency? That is the real quality metric.
| Critical Parameter | Low-Grade System | Engineering-Grade System | Impact on Visual Consistency |
|---|---|---|---|
| Silicone UV Resistance | 80% transmittance at 12 months | 95% transmittance at 36 months | Yellowing creates brand color shift |
| Thermal Cycling Tolerance | ±15°C causes micro-cracking | ±40°C maintains structural integrity | Crack propagation leads to dark zones |
| LED Binning Control | ±200K CCT variation | ±50K CCT variation | Color temperature drift across locations |
| Copper Foil Fatigue Resistance | 5000 thermal cycles before failure | 50000+ thermal cycles | Electrical resistance increase causes dimming |
| Adhesive Long-Term Compatibility | Interface delamination at 8 months | Stable bond over 5 years | Light leakage and dark bands appear |
What Happens Inside Your Neon Sign During the First Year?
The failure pattern is predictable. Month one: perfect visual appearance. Month three: slight yellowing begins in high-UV zones. Month six: curved sections show brightness variation. Month twelve: different locations display obvious visual inconsistency. This is not random degradation. This is physics.
The core mechanism is interface chemistry breakdown. Silicone and adhesive undergo slow chemical incompatibility under thermal stress. LED phosphor coating experiences UV-induced degradation. Copper traces develop oxide layers that increase resistance. These processes are invisible during short-term testing but dominate long-term performance.
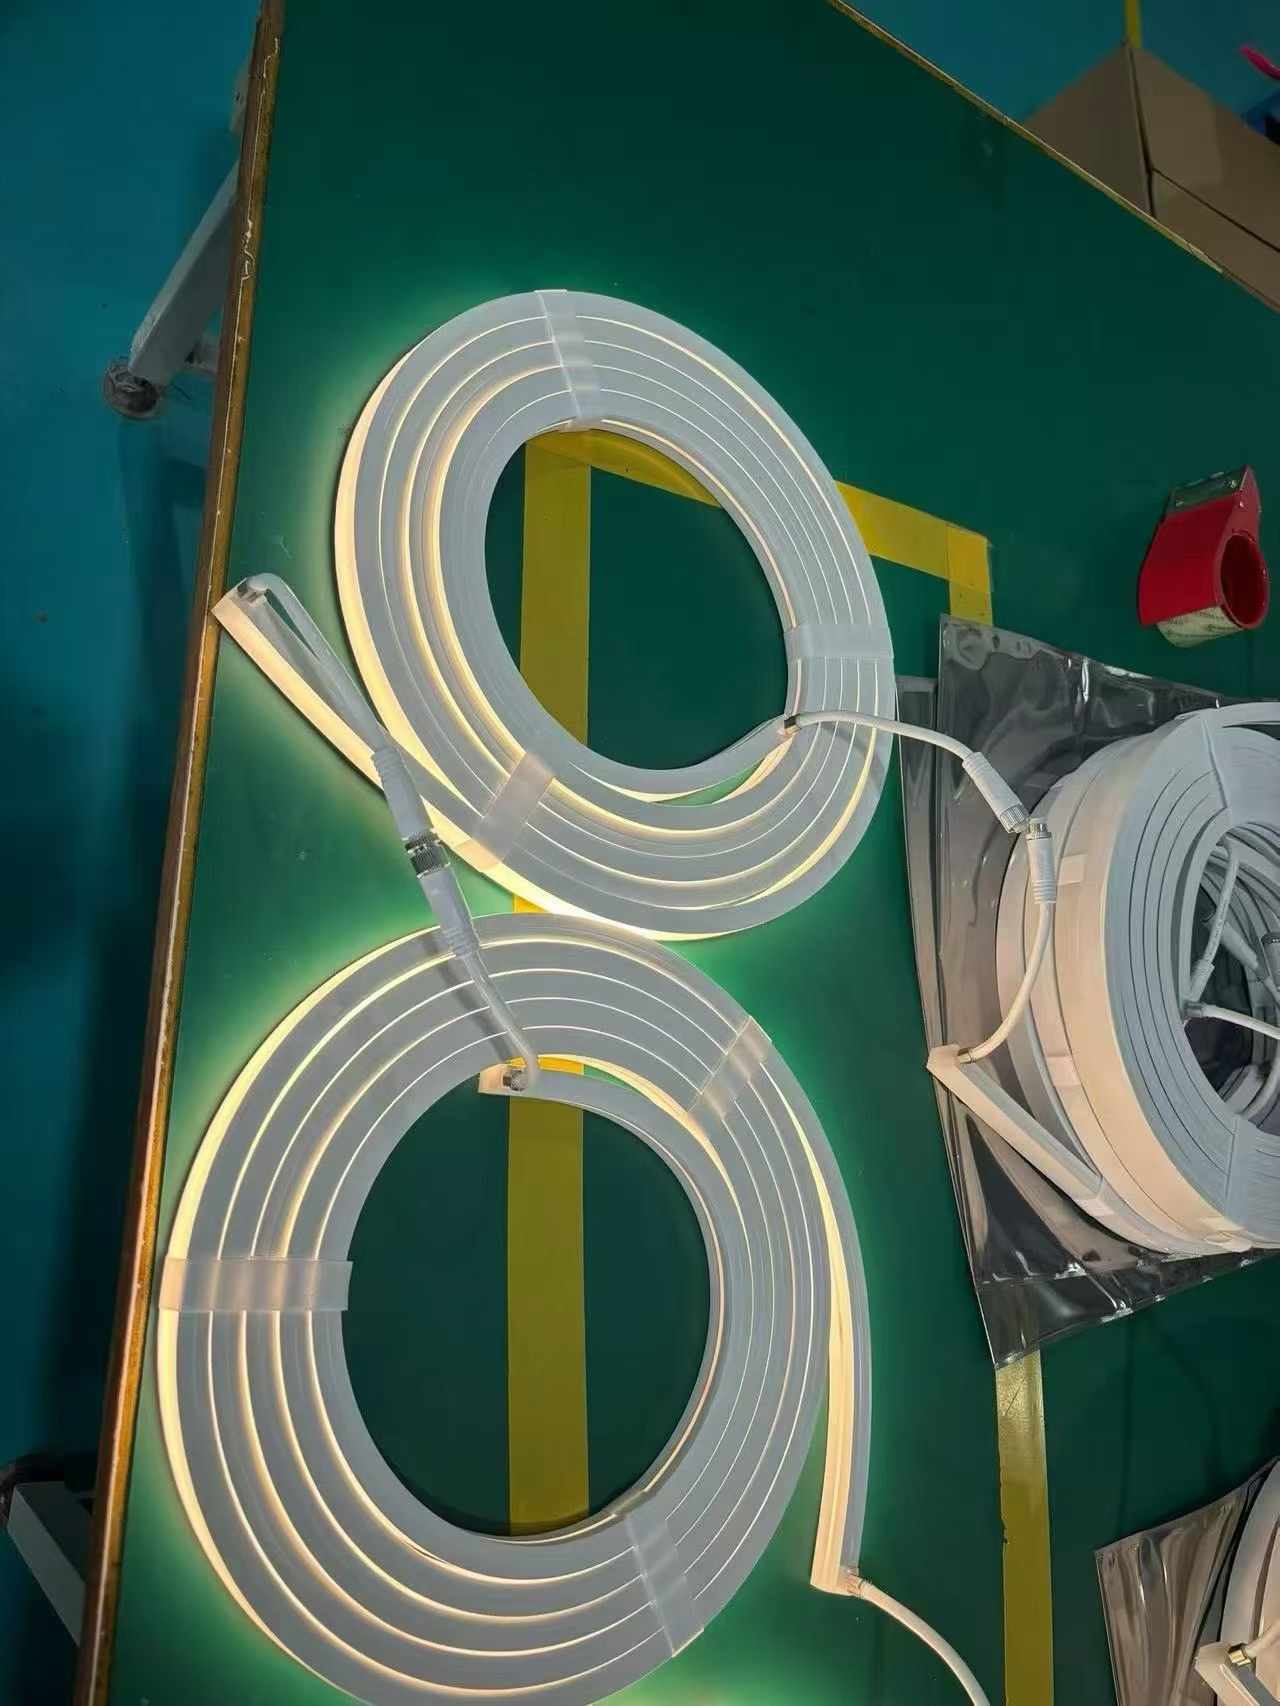
I conducted accelerated aging tests on three silicone grades. We subjected samples to UV radiation equivalent to three years outdoor exposure. We cycled temperature between -20°C and +60°C for 500 cycles. We measured transmittance loss, mechanical property degradation, and interface adhesion strength. The results confirmed what field data already showed. Material selection determines everything.
Low-grade silicone showed 18% transmittance drop after equivalent 18-month exposure. The material turned visibly yellow. Mechanical tensile strength decreased 23%. Adhesive interface started delaminating. High-molecular silicone with proper UV stabilizers showed only 4% transmittance loss. No visible yellowing. Mechanical properties remained within 5% of original values. Adhesive bond maintained full strength. The cost difference? Approximately 15% higher material cost. The performance difference? Three years versus eighteen months useful life before visual degradation becomes brand liability.
The thermal cycling revealed another critical factor. Curved sections experience higher mechanical stress during temperature changes. Silicone expands and contracts. LED circuit board has different thermal expansion coefficient. This creates interface shear stress. Low-quality adhesive cannot accommodate this stress. Micro-cracks form at LED mounting points. Water vapor penetrates through cracks. LED junction corrodes. Brightness drops locally. You get the "dark band" effect in curved letters.
We also discovered that copper foil thickness matters more than most manufacturers acknowledge. Thin copper foil reduces material cost. But it cannot handle repeated bending stress. Fatigue cracks propagate through copper traces. Electrical resistance increases. Ohmic heating concentrates at crack locations. This accelerates degradation. The failure mode is insidious. The sign does not go completely dark. It just gets progressively dimmer in specific sections. Brand consistency disappears gradually.
Voltage regulation emerged as another hidden factor. Most custom neon sign systems use standard LED drivers. These drivers maintain acceptable voltage under rated load. But real-world conditions are not rated conditions. Ambient temperature varies. Input voltage fluctuates. Driver efficiency changes. Output voltage drifts. Even 5% voltage variation creates visible brightness differences across multiple installations. Professional systems use tight-tolerance drivers with thermal compensation. The cost difference is minimal. The visual consistency improvement is substantial.
How Do You Specify a Custom Neon Sign That Stays Consistent?
The specification process determines long-term outcome. Most buyers focus on immediate requirements: design accuracy, brightness level, color temperature, IP rating. These specifications matter. But they do not address time-dependent behavior. Professional specifications include degradation control parameters.
You need to specify UV resistance retention rate, thermal cycling tolerance, batch color consistency limits, and voltage regulation tolerance. These parameters do not appear in standard product datasheets. They require direct communication with engineering teams and access to accelerated aging test data.
I developed a specification framework after analyzing failure patterns across forty commercial projects. The framework focuses on degradation velocity rather than initial performance. Here is how it works in practice.
First, specify silicone UV resistance with numerical retention targets. Instead of "UV resistant silicone," specify "maintains 90% minimum transmittance after 3000 hours UV-A exposure per ASTM G154." This forces manufacturers to use high-molecular silicone with proven UV stabilizer systems. Most suppliers cannot meet this specification. That is the point. You want suppliers who understand degradation chemistry, not just extrusion process.
Second, define thermal cycling requirements based on actual installation environment. Outdoor signage in northern climates experiences -30°C to +50°C variation. Specify "no visible cracking or delamination after 500 thermal cycles between -30°C and +50°C per IEC 60068-2-14." This eliminates suppliers using low-grade adhesive systems that fail under thermal stress.
Third, establish LED binning tolerances that maintain visual consistency across large installations. Standard LED binning allows ±300K color temperature variation. This is acceptable for single-unit installations. For brand networks with fifty locations, you need ±75K maximum variation. Specify "all LED bins within 75K CCT variation, all units tested for color consistency under identical current conditions."
Fourth, require copper foil specifications matched to design geometry. Complex curves need thicker copper to prevent fatigue failure. Specify minimum copper thickness based on minimum bending radius. For example, "copper foil minimum 70μm thickness for sections with bending radius below 50mm." This prevents the micro-cracking failure mode that causes localized dimming.
Fifth, demand driver specifications with tight voltage regulation. Specify "LED driver with maximum 2% voltage variation across full operating temperature range and ±10% input voltage variation." This ensures brightness consistency across installations with different electrical infrastructure.
| Specification Category | Standard Specification | Engineering-Grade Specification | Why It Matters |
|---|---|---|---|
| UV Resistance | "UV resistant material" | "≥90% transmittance retention after 3000h UV-A exposure" | Prevents yellowing and color shift |
| Thermal Cycling | "Operating range -20°C to +50°C" | "Zero cracking after 500 cycles -30°C to +50°C" | Ensures long-term mechanical integrity |
| Color Consistency | "Standard LED binning" | "Maximum ±75K CCT variation across all units" | Maintains brand color uniformity |
| Copper Specification | "Standard PCB copper" | "70μm minimum for R<50mm curves" | Prevents fatigue cracking and resistance increase |
| Voltage Regulation | "Standard LED driver" | "Maximum 2% voltage variation across full range" | Eliminates brightness drift between locations |
Why Do Different Manufacturers Give Different Failure Rates?
You request quotes from five manufacturers. All claim high quality. All provide certifications. All show sample products that look identical. But field failure rates vary from 5% to 35% at twelve months. The difference is not in manufacturing equipment. It is in material selection philosophy and quality control depth.
Low-cost manufacturers optimize for passing short-term tests. Professional manufacturers optimize for controlling long-term degradation. The testing methods are completely different. The material choices are completely different. The results are completely different.
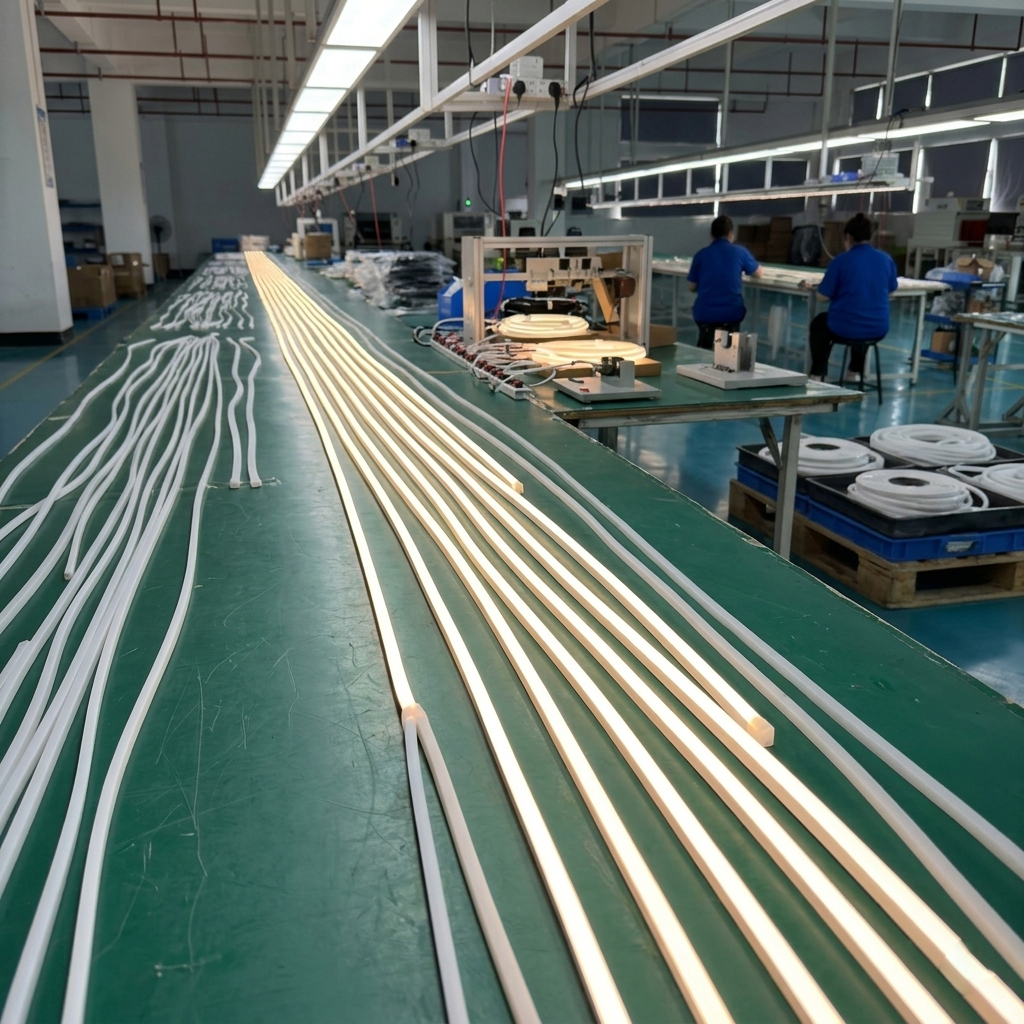
I visited twelve silicone neon flex manufacturers over three years. I observed their quality control processes. The differences became obvious immediately. Low-cost facilities focus on dimensional accuracy and immediate electrical testing. They verify extrusion diameter tolerance. They check initial lumen output. They confirm IP rating through short-duration water immersion. These tests are necessary. But they are insufficient.
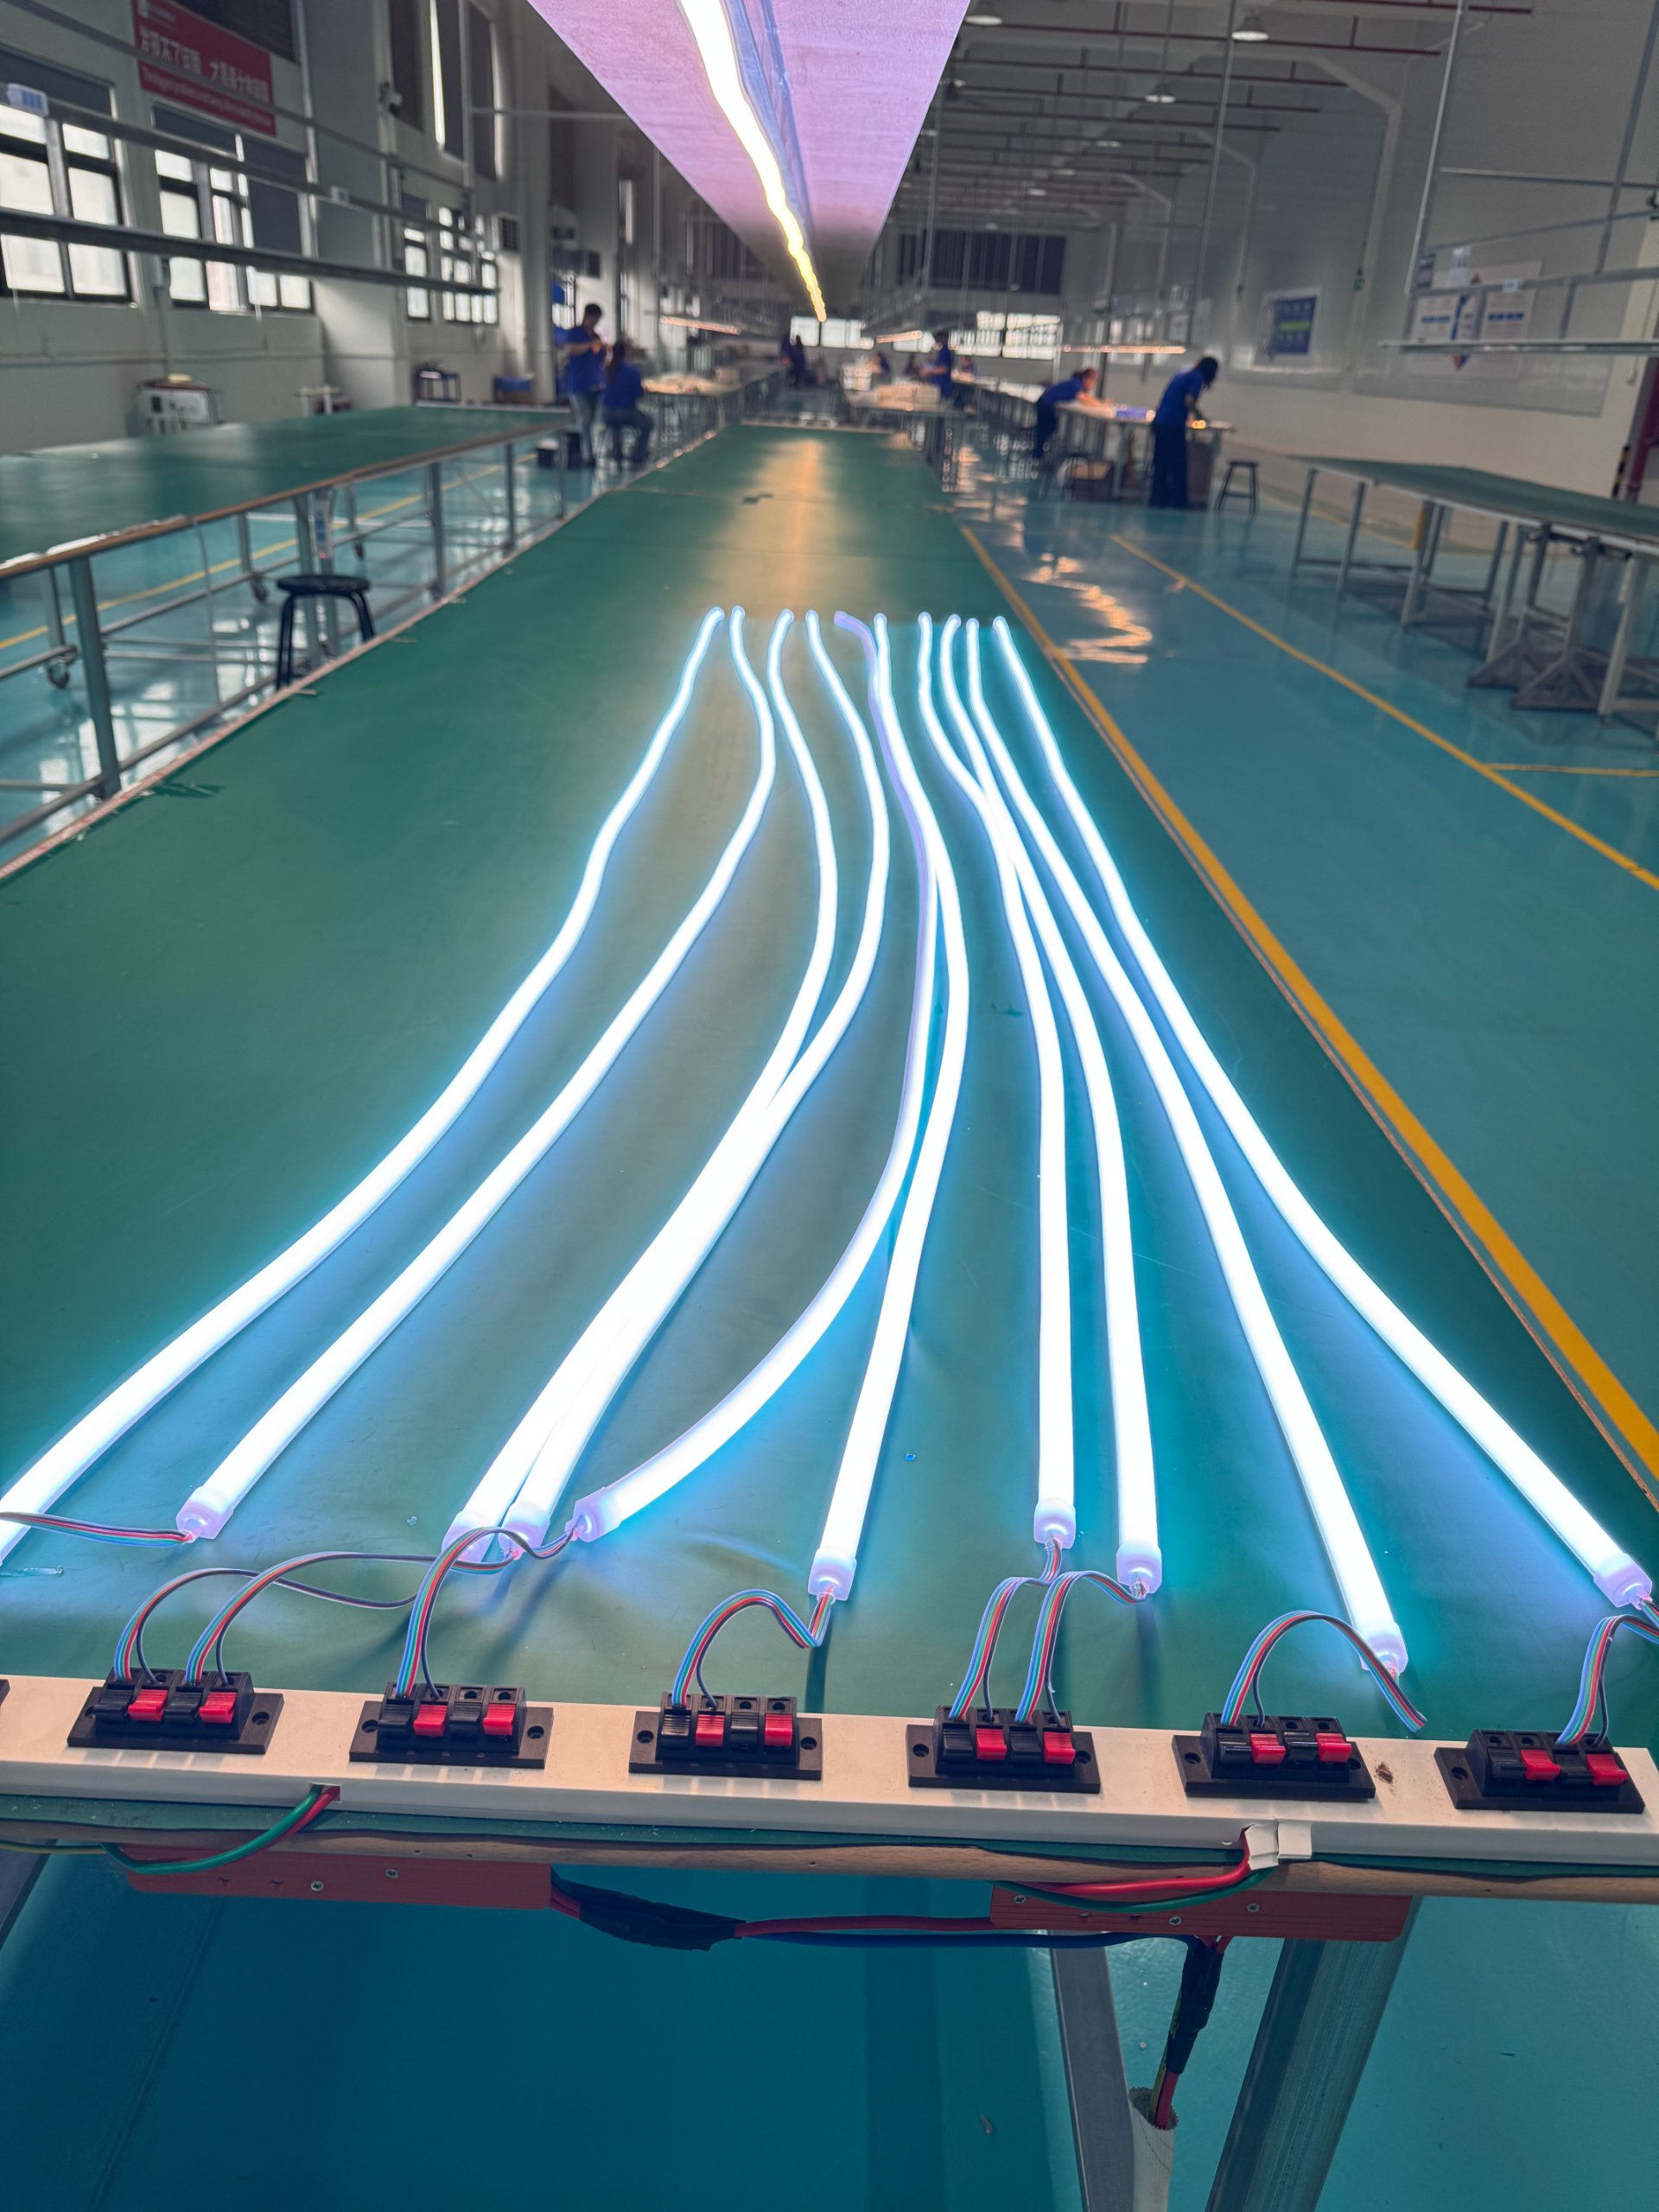
Professional facilities conduct tests that predict long-term behavior. They perform accelerated UV aging on every silicone batch. They run thermal cycling tests on curved samples. They measure LED color consistency across multiple production batches. They track voltage-current curves under temperature variation. They monitor adhesive bond strength after environmental exposure. These tests cost money. They slow down production. They reject material batches that pass standard tests but fail long-term performance criteria.
The material sourcing philosophy differs fundamentally. Low-cost manufacturers select silicone based on price and short-term properties. They purchase from multiple suppliers based on availability. Batch-to-batch variation is common. Professional manufacturers establish long-term relationships with single silicone suppliers. They specify custom formulations with enhanced UV stabilizers. They require certificate of analysis for every batch. They reject batches with out-of-specification parameters even if the difference is small. This material consistency costs approximately 12-15% more. But it eliminates the random quality variation that destroys brand consistency.
LED component sourcing shows similar patterns. Low-cost manufacturers buy LEDs from spot market based on price. Bin mixing is common. Color temperature can vary ±200K between production runs. Professional manufacturers establish direct relationships with LED manufacturers. They purchase from single bin categories. They conduct incoming inspection with spectrophotometer verification. They reject shipments with color variation above specification limits. The cost increase is 8-10%. The color consistency improvement is dramatic.
I conducted a comparative analysis of field failure data. We tracked 500 custom neon sign installations across three manufacturer sources. Low-cost supplier showed 28% units with visible degradation at twelve months. Mid-tier supplier showed 12% degradation rate. Our engineering-grade supplier showed 2% degradation rate. The initial cost difference between lowest and highest was 35%. The total cost of ownership difference including replacement and brand reputation impact was 200%+. You save money short-term. You lose money long-term.
When Should You Replace Your Custom Neon Sign System?
The replacement decision is not binary. Systems do not suddenly fail. They gradually lose visual consistency until brand impact becomes unacceptable. The question is not "when does it break" but "when does degradation exceed brand tolerance."
Professional installations include visual consistency monitoring protocols. You establish baseline color and brightness measurements at installation. You conduct periodic measurements at six, twelve, and twenty-four months. When deviation exceeds predefined limits, you schedule replacement before visual inconsistency becomes customer-facing problem.
We implemented lifecycle monitoring for a global restaurant chain. Three hundred locations. Custom logo neon signs. We established baseline photometric measurements at installation. Color temperature measured with calibrated spectrophotometer. Luminance measured at five points per installation. Data recorded in central database. Field technicians conducted six-month inspections with portable measurement equipment. The data revealed degradation patterns that changed our maintenance strategy.
Initial expectation was five-year replacement cycle. Field data showed different reality. High-UV locations showed 12% brightness degradation at eighteen months. Low-UV interior locations maintained 95% original brightness at thirty-six months. The optimal strategy was not universal replacement at five years. It was location-specific replacement based on measured degradation velocity. High-exposure locations got replaced at twenty-four months. Protected locations lasted sixty months. Total lifecycle cost decreased 40% compared to universal replacement schedule. Brand visual consistency remained within tolerance limits.
The monitoring protocol also revealed unexpected failure modes. Several locations showed brightness degradation concentrated in specific sections. Physical inspection found the root cause. Mounting hardware created stress concentration points. Thermal expansion could not distribute properly. LED junction overheated locally. The fix was not replacement. It was mounting modification to allow thermal expansion. Brightness recovered to baseline levels. This finding changed our installation specifications for all future projects.
Temperature cycling effects became another key insight. Locations with high day-night temperature variation showed faster adhesive degradation. The interface between silicone and mounting surface developed micro-gaps. Water vapor penetrated through gaps. Internal condensation formed. LED junction corrosion accelerated. We modified installation specifications to include vapor barrier for high-cycling environments. Degradation rate decreased substantially. The specification change cost less than 5% additional installation expense. Replacement frequency decreased by approximately 40%.
Conclusion
Custom business neon sign quality is defined by degradation velocity, not initial appearance. Professional systems maintain brand visual consistency over years through material chemistry control, thermal stress management, and electrical stability design. The core difference is not manufacturing capability but understanding of time-dependent material behavior.