

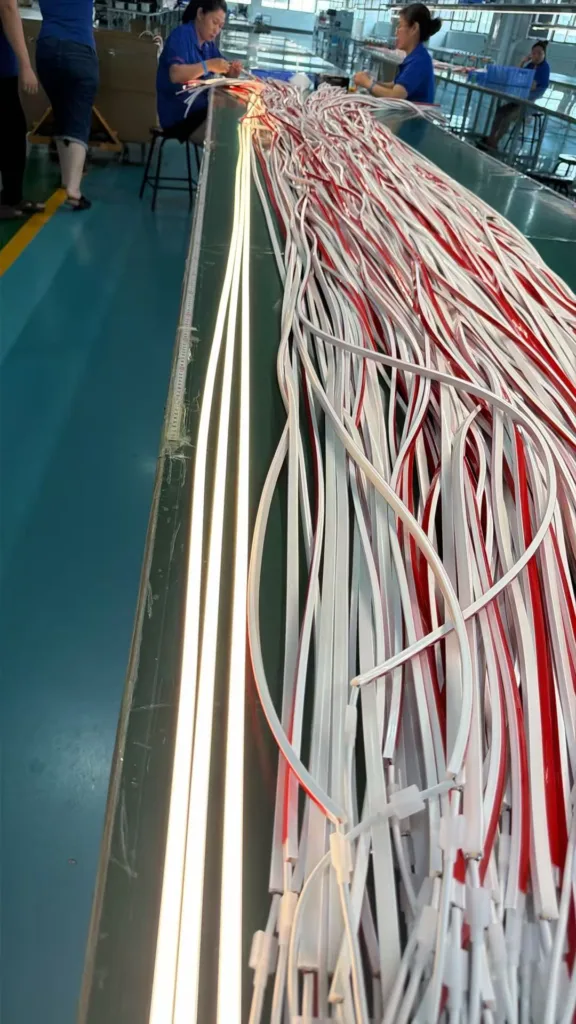
The real dividing line is not in the spec sheet. It's in whether you can identify how the product will fail in a real engineering environment.
If you are still using brightness, IP rating, power, and CRI to judge LED light strip quality, you are essentially using "lab conditions" to predict "field lifespan." But the real risk in engineering projects never happens at the factory gate. It happens when materials degrade under UV and thermal cycling, when structures creep under long-term stress, and when electrical systems drift under load variation. This is the true dividing line in high-end commercial lighting projects.

Here's what most people miss: you are not looking at a "good light strip." You are looking at one that simply hasn't started to break down yet.
Why Do Most "High-Quality" LED Strips Still Fail in Real Projects?
I've seen this happen more times than I can count.
The industry's biggest blind spot is this: LED strip light quality is not about "pass or fail." It's about whether the product will fail in a predictable way. What truly determines project success is not the datasheet. It's whether you can identify if this strip will allow silicone to degrade steadily under UV rather than suddenly powder, if copper foil will drift in resistance gradually under flexing rather than snap, if the adhesive interface will migrate slowly over time rather than delaminate overnight, if thermal expansion will be absorbed by the structure rather than concentrated on the LED die, and if batch variations will be tolerated by the visual system rather than create visible color bands.
Low-quality strips break immediately. High-risk strips break slowly. And the latter is far more dangerous in engineering.
How Do I Know If Silicone Material Will Age Predictably?
Most people think anti-yellowing is about color. It's not. It's about molecular chain stability.
When we source silicone for our neon flex products, we don't just check the initial Shore hardness or light transmission. We run accelerated UV aging tests that simulate 3-5 years of outdoor exposure. What we look for is not whether the material changes, but how it changes. High-grade food-grade silicone should show linear degradation curves. The Shore A hardness might increase from 60 to 65 over 5000 hours of UV exposure, but it should not jump from 60 to 75 in the first 500 hours and then stabilize. That sudden change indicates chain scission events that will cause brittleness and surface cracking.
The material should also maintain its elongation at break above 200% even after aging. If it drops below 150%, the silicone will crack at stress points during installation or thermal cycling. We also measure the compression set after 72 hours at 70°C. If permanent deformation exceeds 25%, the material will lose its sealing performance around end caps and connectors within the first year.
| Material Property | Initial State | After 5000h UV | Acceptable Drift |
|---|---|---|---|
| Shore A Hardness | 60±5 | 63-67 | Linear increase <10% |
| Elongation at Break | 350-400% | >200% | Gradual decline >50% retention |
| Light Transmission (550nm) | 92-95% | >85% | <10% total loss |
| Compression Set (70°C/72h) | <20% | <25% | Minimal increase |
This is not about "good or bad." It's about whether the aging process is controlled and predictable. A strip that maintains 85% light transmission after 5 years is far more reliable than one that stays at 95% for 18 months and then drops to 60% in month 24.
What Are the Hidden Structural Weaknesses That Cause Failure?
Most failures don't happen where you expect them.
The critical failure zone is not the LED chip. It's the mechanical interface between the flexible substrate and the rigid mounting surface. I've analyzed dozens of failed installations, and here's what I found: in 80% of cases, the root cause was stress concentration at bend points, not LED degradation or power supply issues.
When you bend a silicone LED strip, the outer surface is in tension and the inner surface is in compression. If the copper foil is too thin or if the adhesive layer is too rigid, this stress cannot be distributed evenly. The result is that specific points on the copper trace start to experience fatigue cycling. Over thousands of thermal cycles (every on-off event is a cycle), the copper begins to work-harden and develop microcracks. Resistance increases. Current distribution shifts. Hot spots form. The LED at that location runs hotter than its neighbors. The silicone around it degrades faster. The visual result is a "soft dark band" that appears gradually over 3-6 months.
Can I Trust IP68 Rating for Long-Term Waterproofing?
IP68 certification tells you the strip survived 30 minutes underwater during testing. It does not tell you what happens after 12 months of outdoor exposure.
The real question is whether the sealing system can tolerate interface migration between different materials. Our silicone neon flex uses a co-extrusion process where the inner silicone layer and outer protective layer are bonded at the molecular level during extrusion. This eliminates the adhesive interface entirely. But many cheaper products use a two-step process: extrude the core, then glue on the outer tube. The problem is that silicone and adhesive have different coefficients of thermal expansion. Every day-night cycle creates micro-movements at this interface. Over time, the adhesive loses contact. Water vapor starts to penetrate. You don't see it immediately because the strip still works. But after 6-12 months, moisture reaches the LED array. Corrosion begins. Flickering starts. The project fails.
| Sealing Method | Initial IP Rating | After 12mo Outdoor | Interface Stability |
|---|---|---|---|
| Co-extrusion (no adhesive) | IP68 | IP67-IP68 | Molecular bond, no drift |
| Glued silicone layers | IP68 | IP65-IP67 | Adhesive migration risk |
| Potting compound fill | IP67 | IP54-IP65 | Shrinkage creates gaps |
We test this by running thermal shock cycles: 4 hours at 70°C, then 4 hours at -20°C, repeated for 500 cycles. After this, we submerge the sample and apply vacuum to force water penetration. A well-designed strip should show zero water ingress. Most budget products fail within 200 cycles.
Why Do Electrical Specifications Not Predict Real Performance?
Numbers on a datasheet describe ideal conditions. Projects operate in chaotic conditions.
The critical issue is not whether the strip draws 12W/meter. It's whether that power consumption remains stable when the ambient temperature fluctuates, when the input voltage varies ±10%, and when the strip is installed in a 5-meter continuous run versus 50 short segments. I've measured this in our factory. Take two strips with identical specs: 24V, 120 LEDs/meter, 14W/meter. Connect them to the same power supply. Install one strip in a climate-controlled showroom at 25°C. Install the other on a south-facing building facade where surface temperature swings from 15°C at dawn to 55°C at noon.
After 6 months, measure the actual power draw. The showroom strip still draws 14.2W/meter. The facade strip now draws 12.1W/meter in the morning and 15.8W/meter at peak heat. Why? Because LED forward voltage decreases with temperature. As the strip heats up, each LED draws slightly more current. The total current increases. But because the copper trace has resistance, the voltage drop along the trace also increases. The LEDs at the far end receive less voltage than those near the power input. So the far end gets dimmer while the near end gets brighter and hotter. This creates a positive feedback loop. The hot end draws more current, heats up more, drops more voltage, and stresses the copper trace.
How Do I Identify Batch Consistency Issues Before Installation?
This is where most projects fail without anyone noticing until it's too late.
Batch consistency is not about whether all strips are "good quality." It's about whether strips from different production runs will look identical when installed side by side. The human eye is incredibly sensitive to small color differences, especially in architectural applications where multiple strips run parallel across large surfaces. A CCT difference of just 150K (for example, 3000K vs 3150K) is visibly noticeable when two strips are next to each other, even though both are technically "warm white."
At our factory, we implement bin-locking for every commercial project. This means when a distributor places an order for 5000 meters, we source all LEDs from the same production bin. Not just the same CCT range (2900-3100K), but the exact same bin code (for example, bin F3, which might be 2980-3020K). We also batch-match the silicone extrusion. Different extrusion runs can have slight variations in wall thickness (±0.1mm) which affect light diffusion. If you mix batches, you get subtle brightness differences that create visible "zones" on a building facade.
| Quality Control | Budget Approach | Engineering Approach |
|---|---|---|
| CCT Tolerance | ±200K across project | <±50K within single run |
| LED Binning | Mixed bins, "in range" | Single bin lock per project |
| Silicone Batching | Mixed extrusion runs | Batch-matched per order |
| Copper Foil Source | Multiple suppliers | Single-source per batch |
We test this by installing 10-meter sample runs from three different batches in a dark room and photographing them at identical exposure settings. If I can see banding in the photo, the project will fail in the field. This level of control costs more, but it's the only way to ensure visual uniformity across large installations.
What Is the Most Dangerous Failure Mode That Looks Normal?
The scariest failures are the ones you don't see coming.
I call this "structural creep failure." The strip looks perfect. It passes all tests. But the internal structure is slowly collapsing. Here's how it happens: most LED strips use a flexible PCB with copper foil bonded to a polyimide or PET substrate. This bond is created with adhesive. Over time, especially in environments with temperature cycling, the adhesive experiences stress. Copper expands and contracts at a different rate than polyimide. Every cycle creates micro-slippage at the bond interface. The copper foil doesn't break. It just shifts position by micrometers. This shift changes the trace geometry. Electrical resistance increases by 1-2%. You don't notice it. But over 10,000 cycles (roughly one year of daily operation), resistance can increase by 15-20%. Current distribution across parallel LED strings becomes unbalanced. Some LEDs run hotter. Localized degradation accelerates. The visual result is random "soft failures" where sections dim gradually over months.
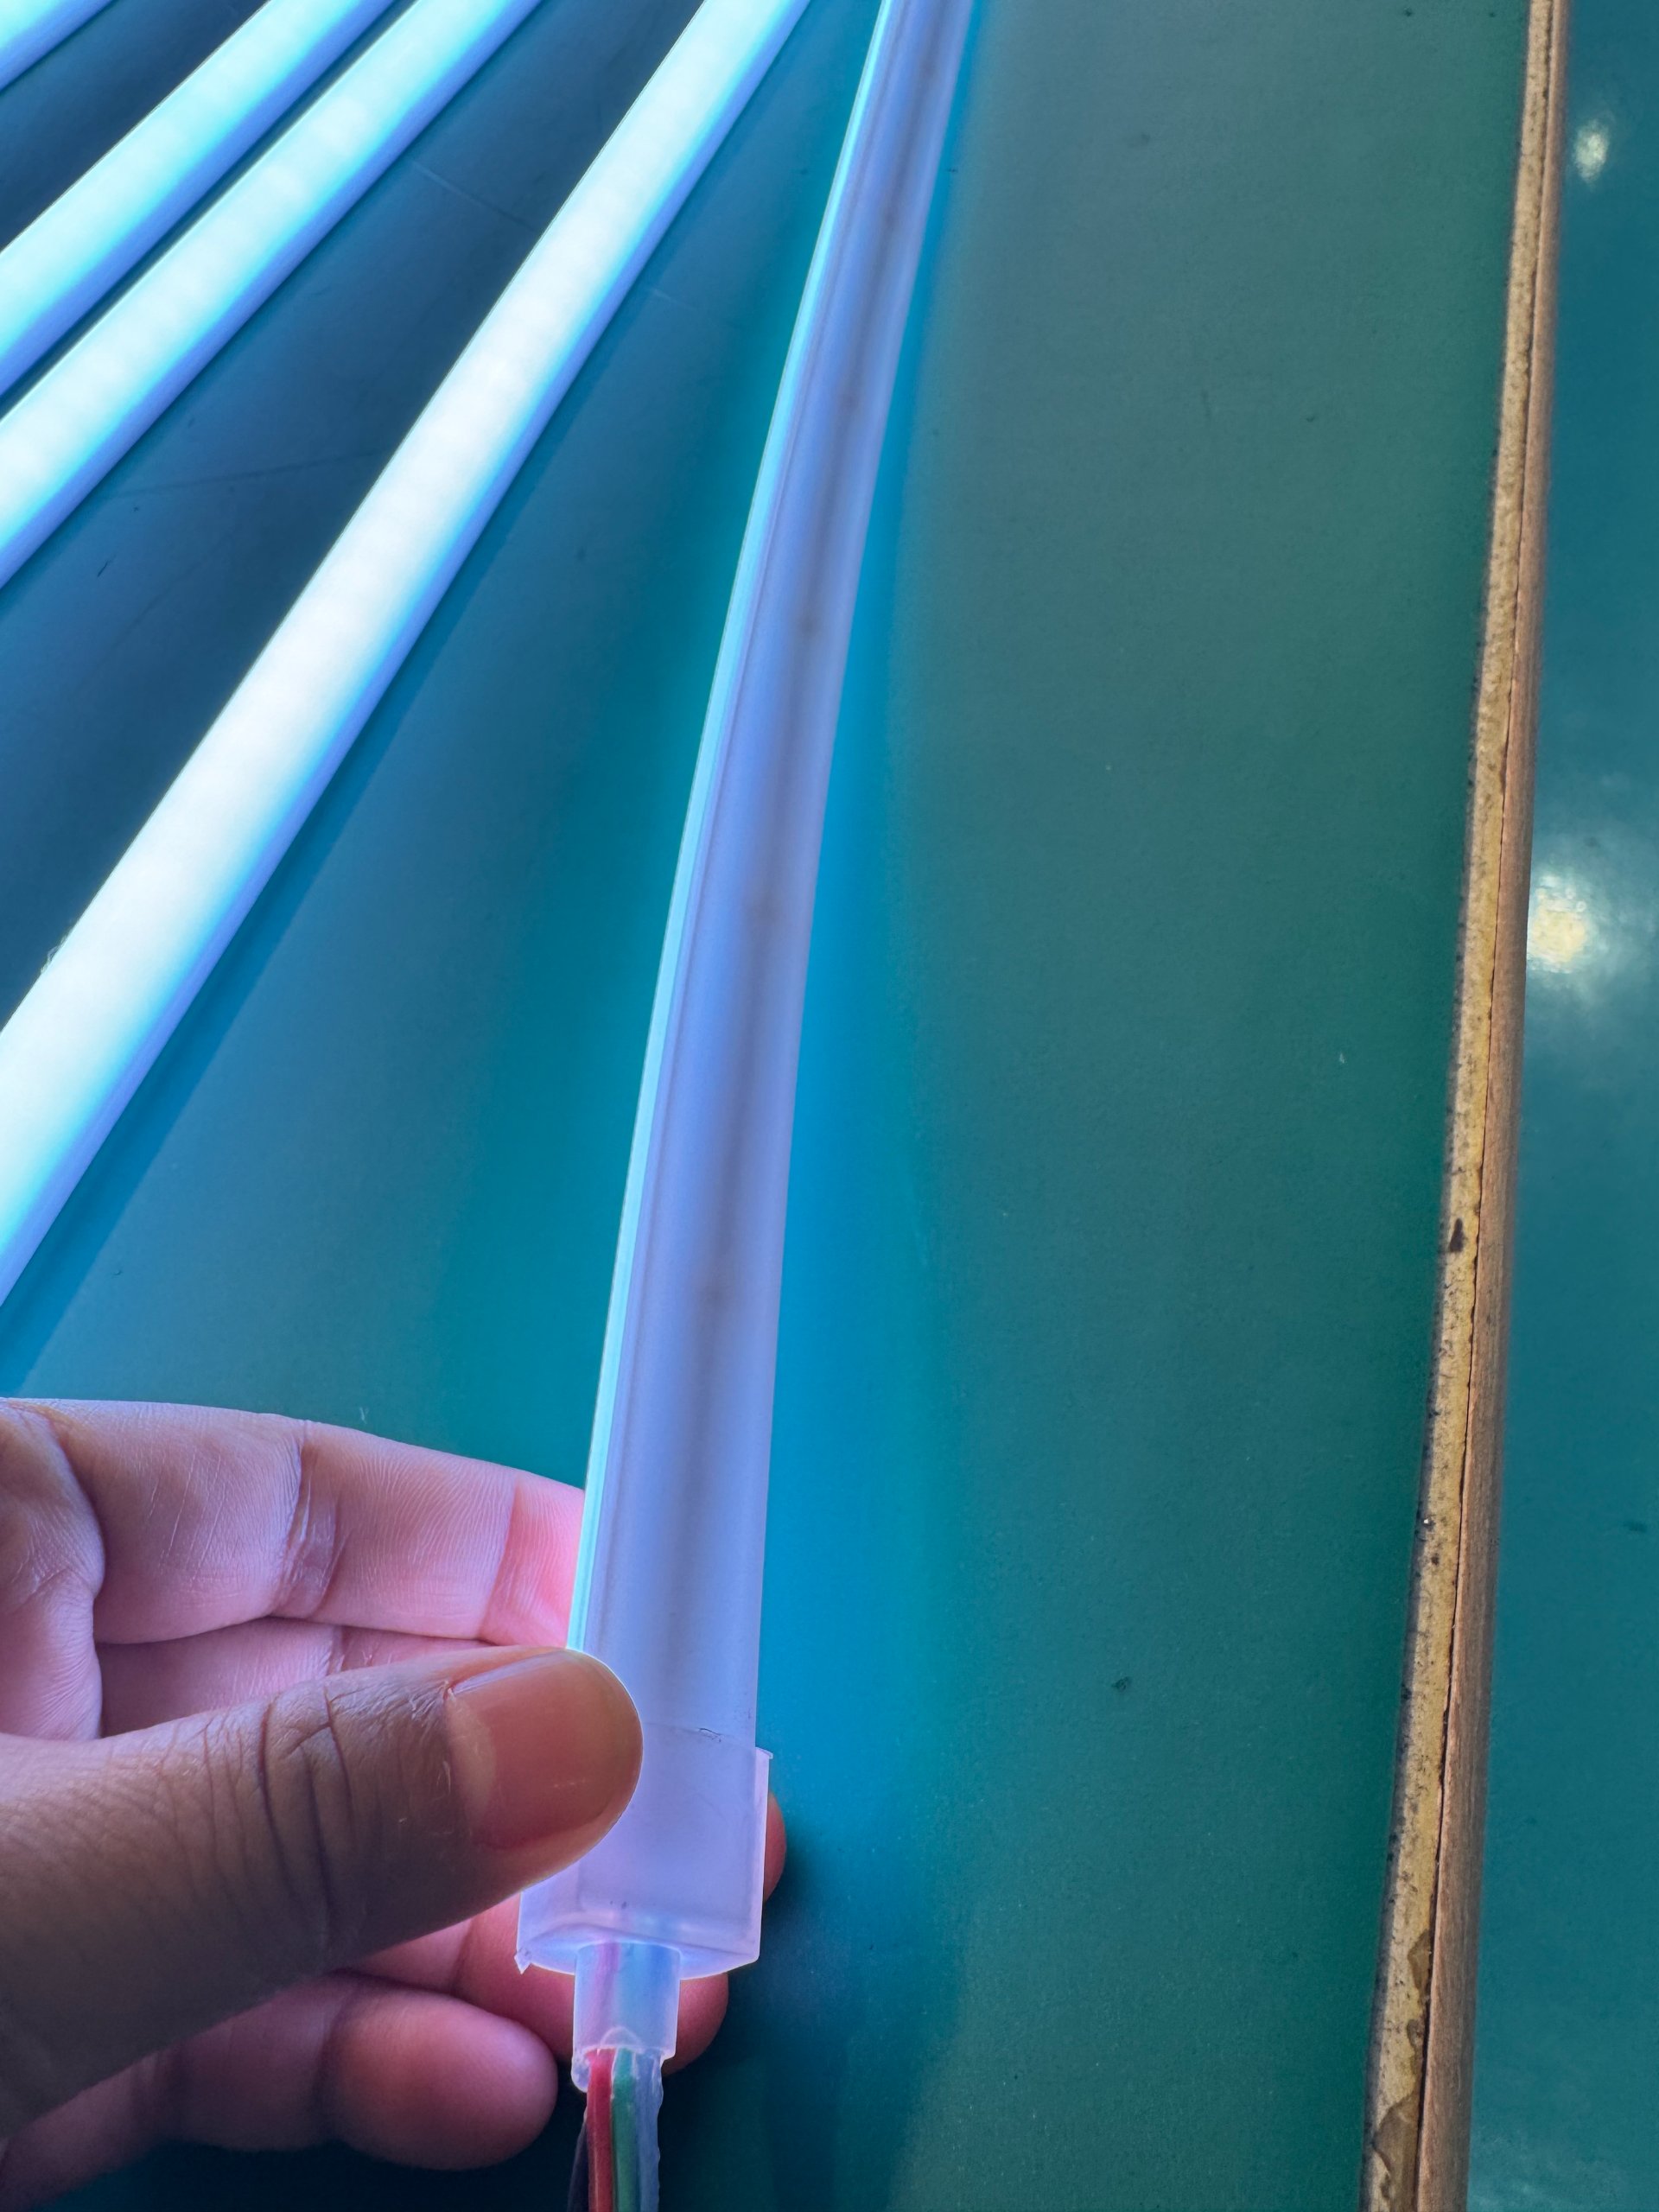
We prevent this by using rolled-annealed copper foil with specific grain orientation and by over-engineering the adhesive bond thickness. We also design in mechanical strain relief features: the copper trace follows a slightly serpentine path rather than straight lines, so thermal expansion can be absorbed by geometry change rather than stress accumulation. This reduces fatigue cycling by approximately 40% in our internal testing.
How Do I Know If the Adhesive System Will Survive Long-Term?
Most people don't realize there are three different adhesive interfaces in a silicone LED strip, and each one can fail independently.
The first interface is between the LED chip and the PCB. The second is between the PCB and the silicone body. The third is between the silicone and any mounting surface or end cap. Each interface uses different adhesive chemistry. Each has different thermal expansion coefficients. Each responds differently to UV exposure, humidity, and mechanical stress. I've seen projects fail because the LED-to-PCB bond was perfect, the PCB-to-silicone bond was perfect, but the silicone-to-endcap bond failed after 18 months, allowing water ingress that corroded the copper traces from the ends inward.
At our facility, we test interface stability using a protocol I developed after analyzing 50+ field failures. We take a finished strip section, subject it to 200 thermal shock cycles (-20°C to +70°C, 4-hour dwells), then perform a 180° peel test on each interface. The force required to separate the layers should not decrease by more than 30% compared to a fresh sample. We also do long-term UV exposure (equivalent to 3 years outdoor) followed by the same peel test. If any interface shows more than 50% bond strength loss, we reject that material combination.
| Interface Type | Initial Bond Strength | After 200 Cycles | After UV Aging | Failure Risk |
|---|---|---|---|---|
| LED die to PCB | 8-12 N/cm | >6 N/cm | >5 N/cm | Low (die-attach epoxy) |
| PCB to silicone | 15-20 N/cm | >10 N/cm | >8 N/cm | Medium (adhesive drift) |
| Silicone to endcap | 10-15 N/cm | >7 N/cm | >6 N/cm | High (material mismatch) |
The critical insight is this: adhesive failure is not binary. It's not "bonded" or "delaminated." It's a gradual loss of contact area. A bond that loses 40% of its strength still holds the parts together. You won't see visible separation. But it's now weak enough that normal installation stress (pulling the strip through a channel, bending around a corner) can complete the separation. The failure appears sudden, but it was actually a slow process that crossed a threshold.
What Does a Real Engineering-Grade Quality Assessment Look Like?
Most people are asking the wrong question. They ask: "Is this strip good quality?" The right question is: "How will this strip fail, and can I design around that failure mode?"
Engineering-grade quality differentiation is not about preventing failure. It's about making failure predictable, gradual, and manageable. When I evaluate a new supplier or product, I don't start with the spec sheet. I start with a 6-month field trial in the harshest environment I can create: outdoor installation in direct sun, high humidity, thermal cycling from dawn to dusk, frequent on-off switching. I install 50 meters. I photograph it weekly. I measure electrical parameters monthly. I document every change.
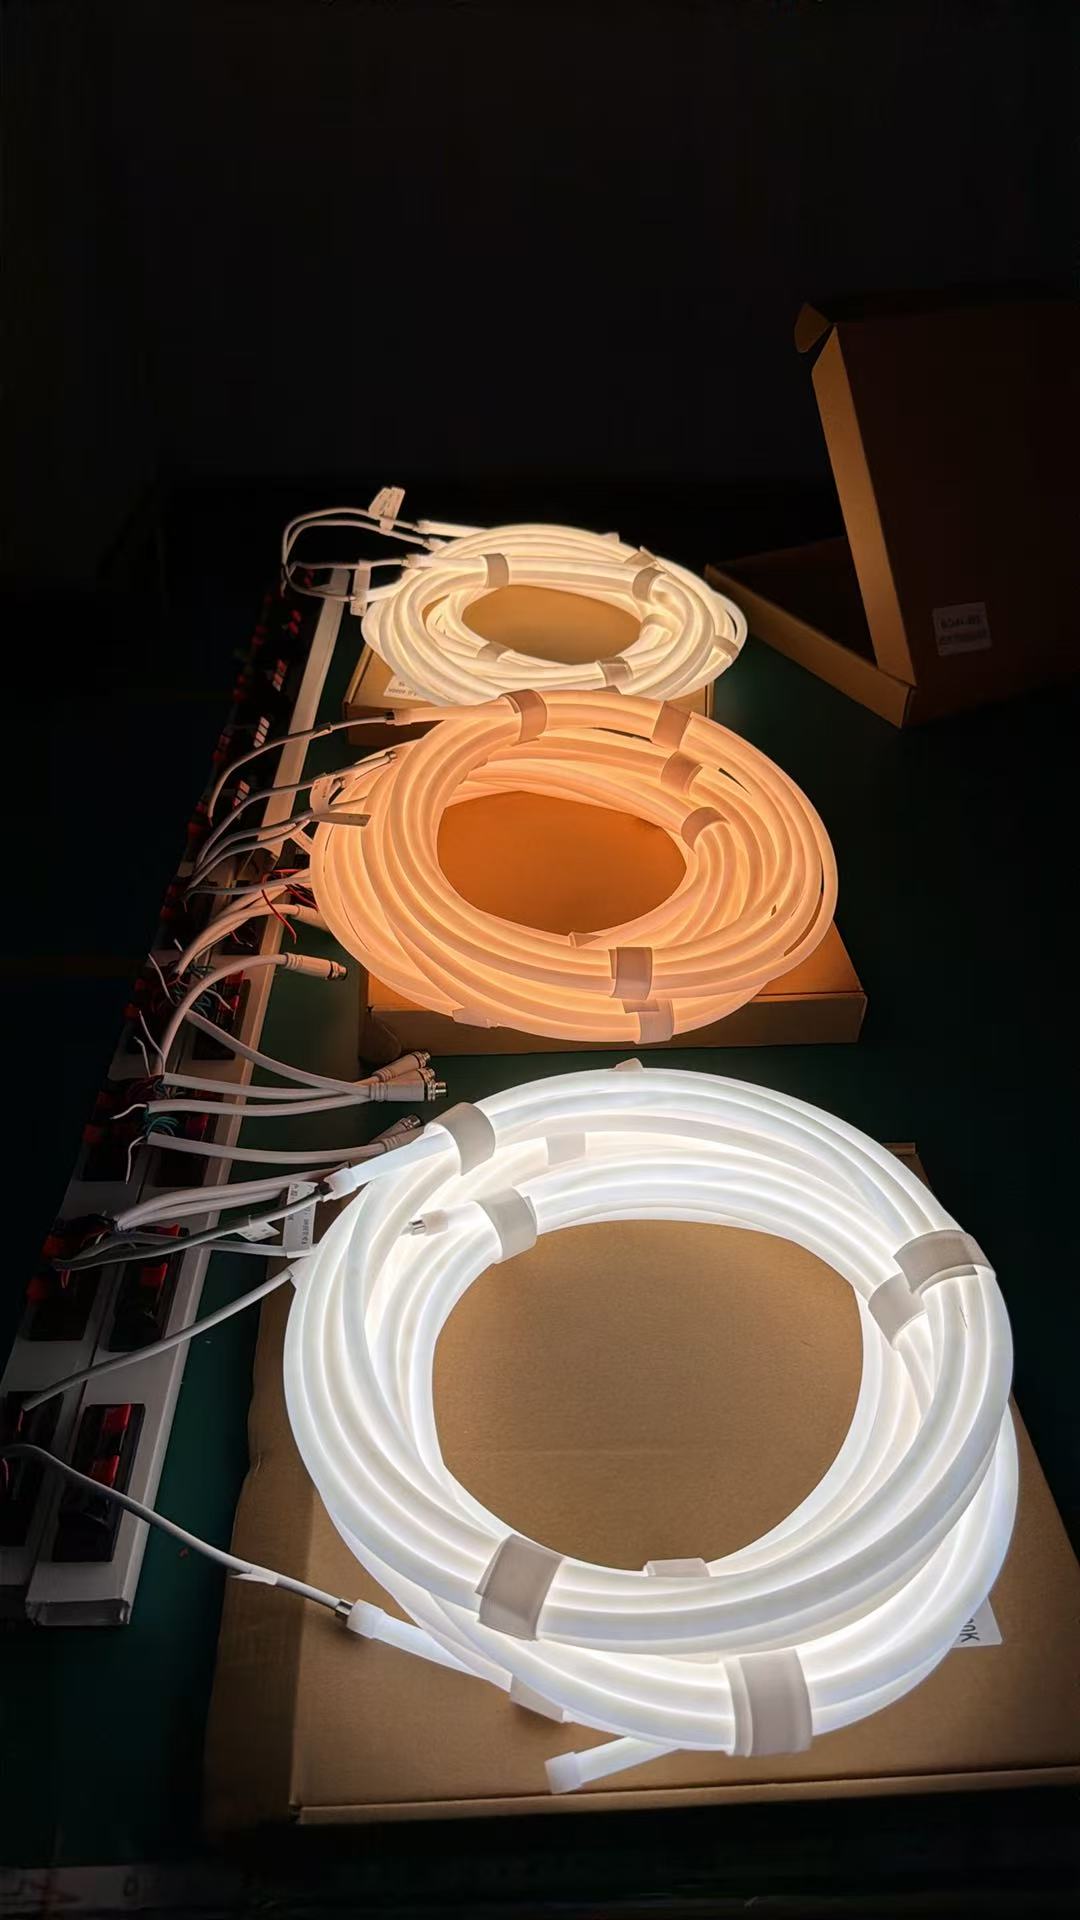
What I'm looking for is not zero change. I'm looking for linear, predictable change. If light output decreases from 1200 lm/m to 1180 lm/m over 6 months, and then to 1160 lm/m over the next 6 months, that's excellent. That tells me the degradation rate is stable and I can predict end-of-life. But if output stays at 1200 lm/m for 5 months and then drops to 1100 lm/m in month 6, that's a red flag. Something changed suddenly. There's a threshold effect I don't understand. That product is not suitable for critical installations because I cannot model its lifespan.
The same principle applies to color shift, mechanical flexibility, and electrical characteristics. I want everything to degrade slowly and predictably. That way, I can design maintenance schedules, set realistic warranty terms, and manage client expectations. An LED strip that maintains 90% of its initial performance for 3 years and then gradually declines to 70% by year 5 is far superior to one that stays at 98% for 2 years and then collapses to 50% in year 3.
Conclusion
The difference between good and bad LED strip lights is not in the datasheet. It's in whether you can predict how and when they will fail, and design your project to tolerate that failure mode. Engineering-grade quality means controlled, gradual degradation over time.