

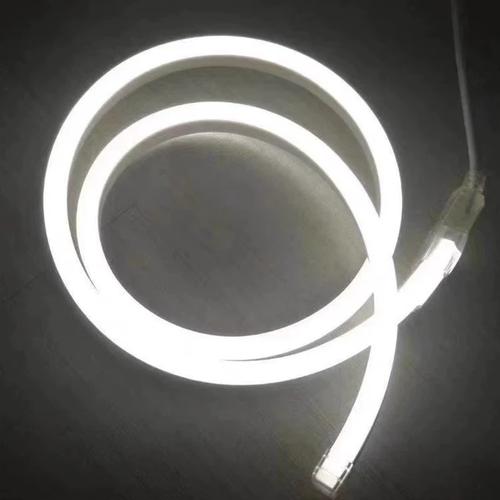
Most buyers focus on size, color, and brightness when sourcing bespoke LED neon strips. They miss the real problem. Customization doesn't just change appearance. It rewrites the entire material system, thermal management structure, and mechanical stress distribution. Projects fail not because customization is impossible, but because nobody re-validates the risks after modification.
Custom LED neon strips require complete system re-validation. Every dimensional change affects thermal pathways, stress points, and long-term reliability. Most failures happen 18-24 months after installation, when initial design flaws finally manifest as systematic degradation. Professional suppliers don't just deliver custom shapes—they re-engineer the entire reliability model.
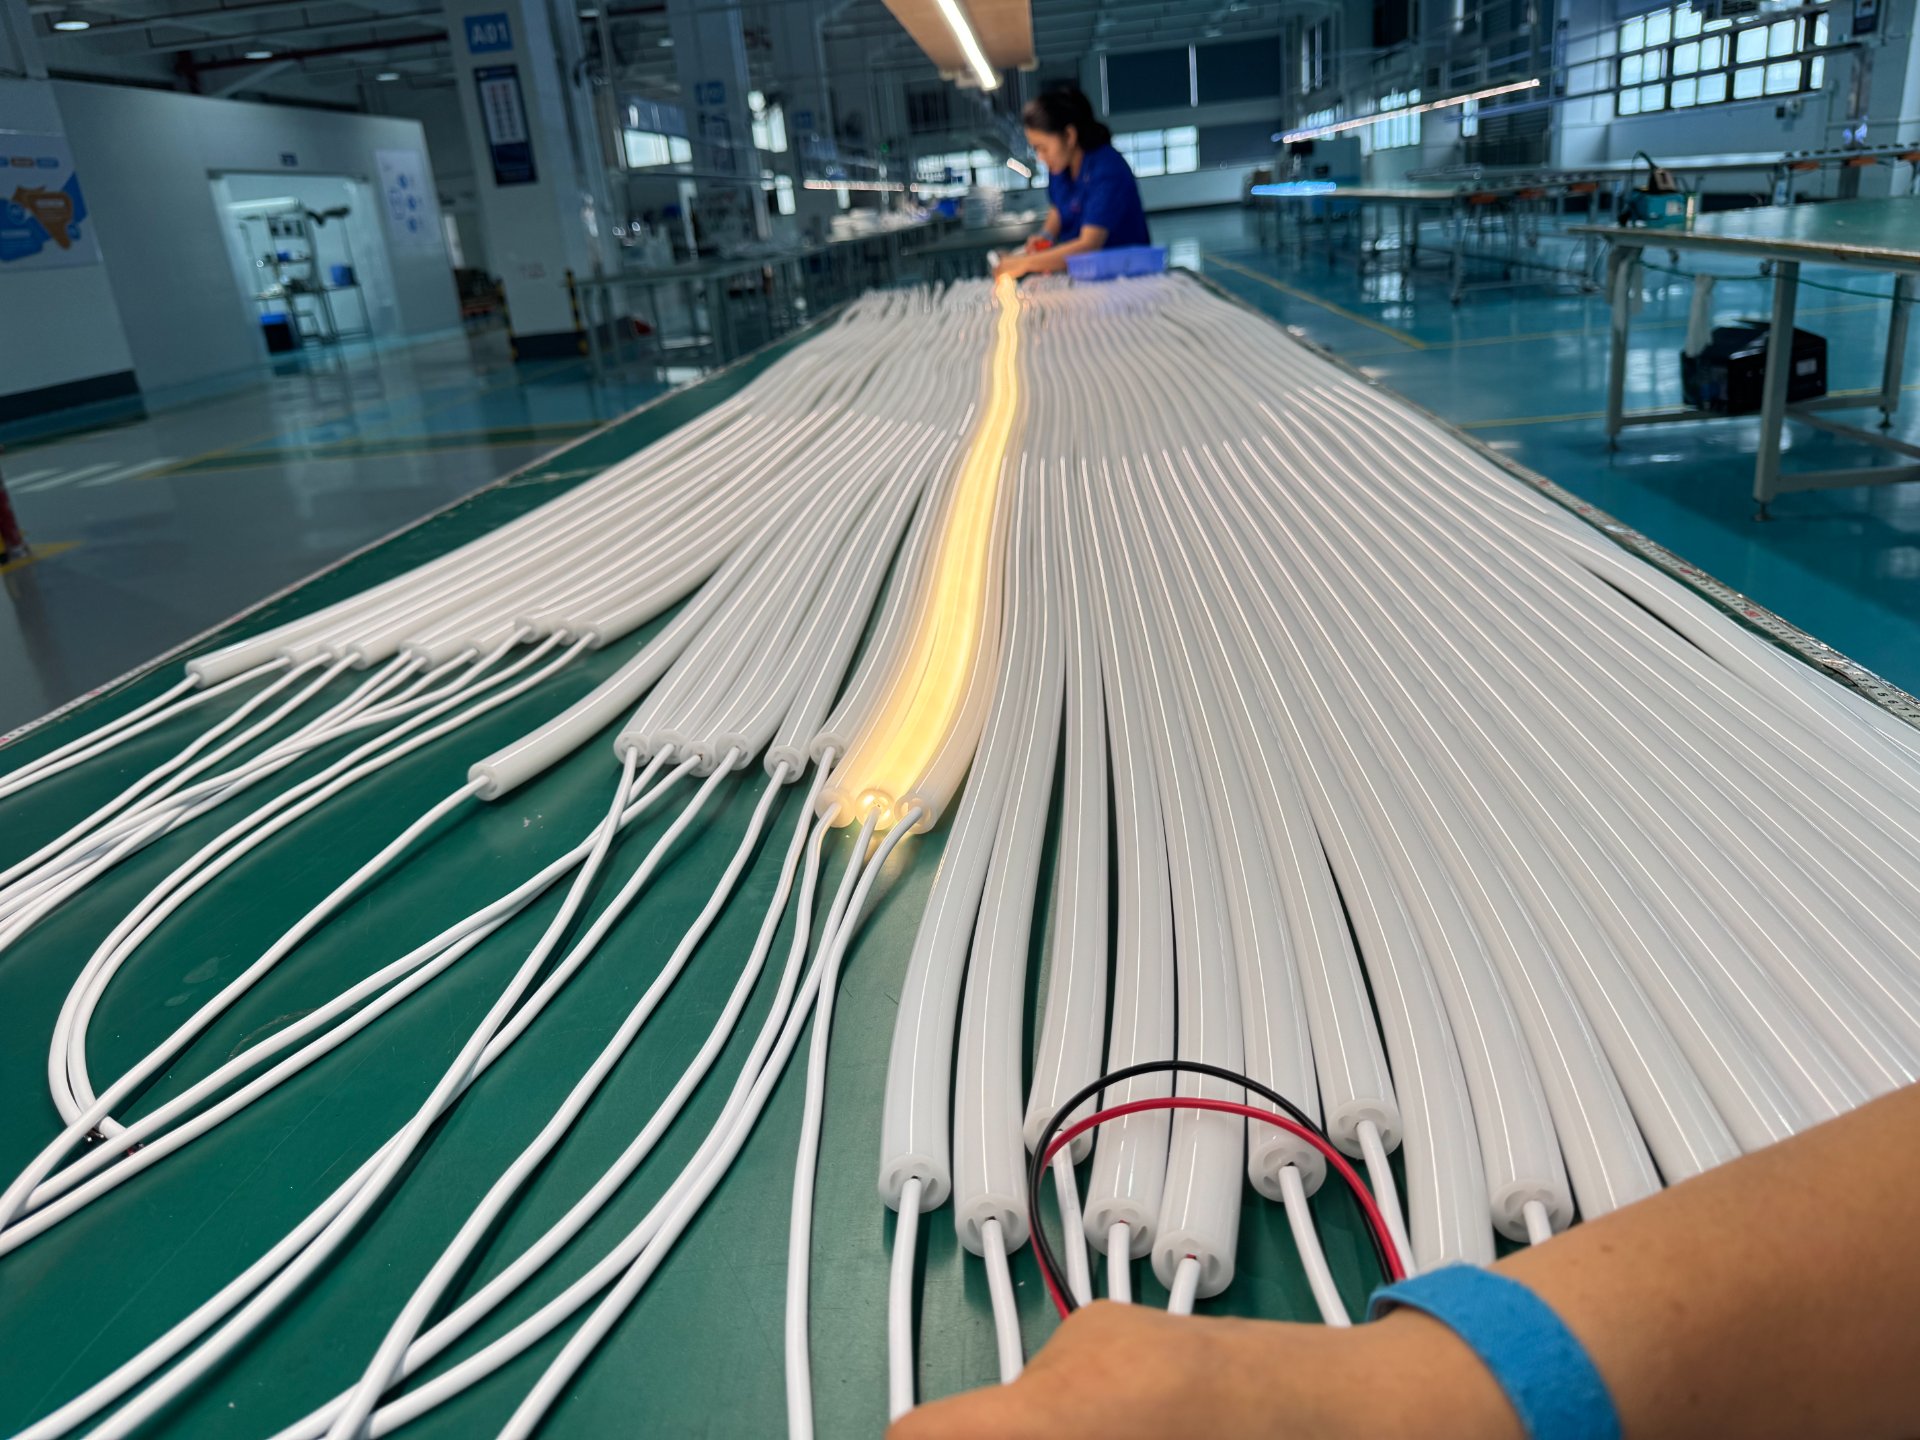
I have watched hundreds of custom neon projects move from stunning samples to widespread field failures. The pattern repeats itself. Buyers get excited about visual effects during the sample stage. They approve mass production. Installation looks perfect. Then summer heat arrives. Or winter cold sets in. Slowly, dark spots appear. Color shifts emerge. Within two years, entire sections need replacement. The root cause traces back to one moment: when someone changed a dimension without re-validating the thermal and mechanical consequences.
What Actually Changes When You Customize LED Neon Strip Dimensions?
People think customization means adjusting a few numbers. Width becomes narrower. Thickness gets thinner. Bending radius shrinks. They see these as simple modifications. I see them as fundamental system alterations. Each change triggers a cascade of physical consequences that standard products never face.
Every dimensional modification in LED neon strips changes three critical systems simultaneously: heat dissipation pathways, mechanical stress distribution, and material fatigue characteristics. A 20% reduction in silicone wall thickness can increase thermal resistance by 40%. A narrower PCB reduces copper cross-section, concentrating heat in smaller areas. These changes compound over time, creating failure modes that don't appear in accelerated testing.
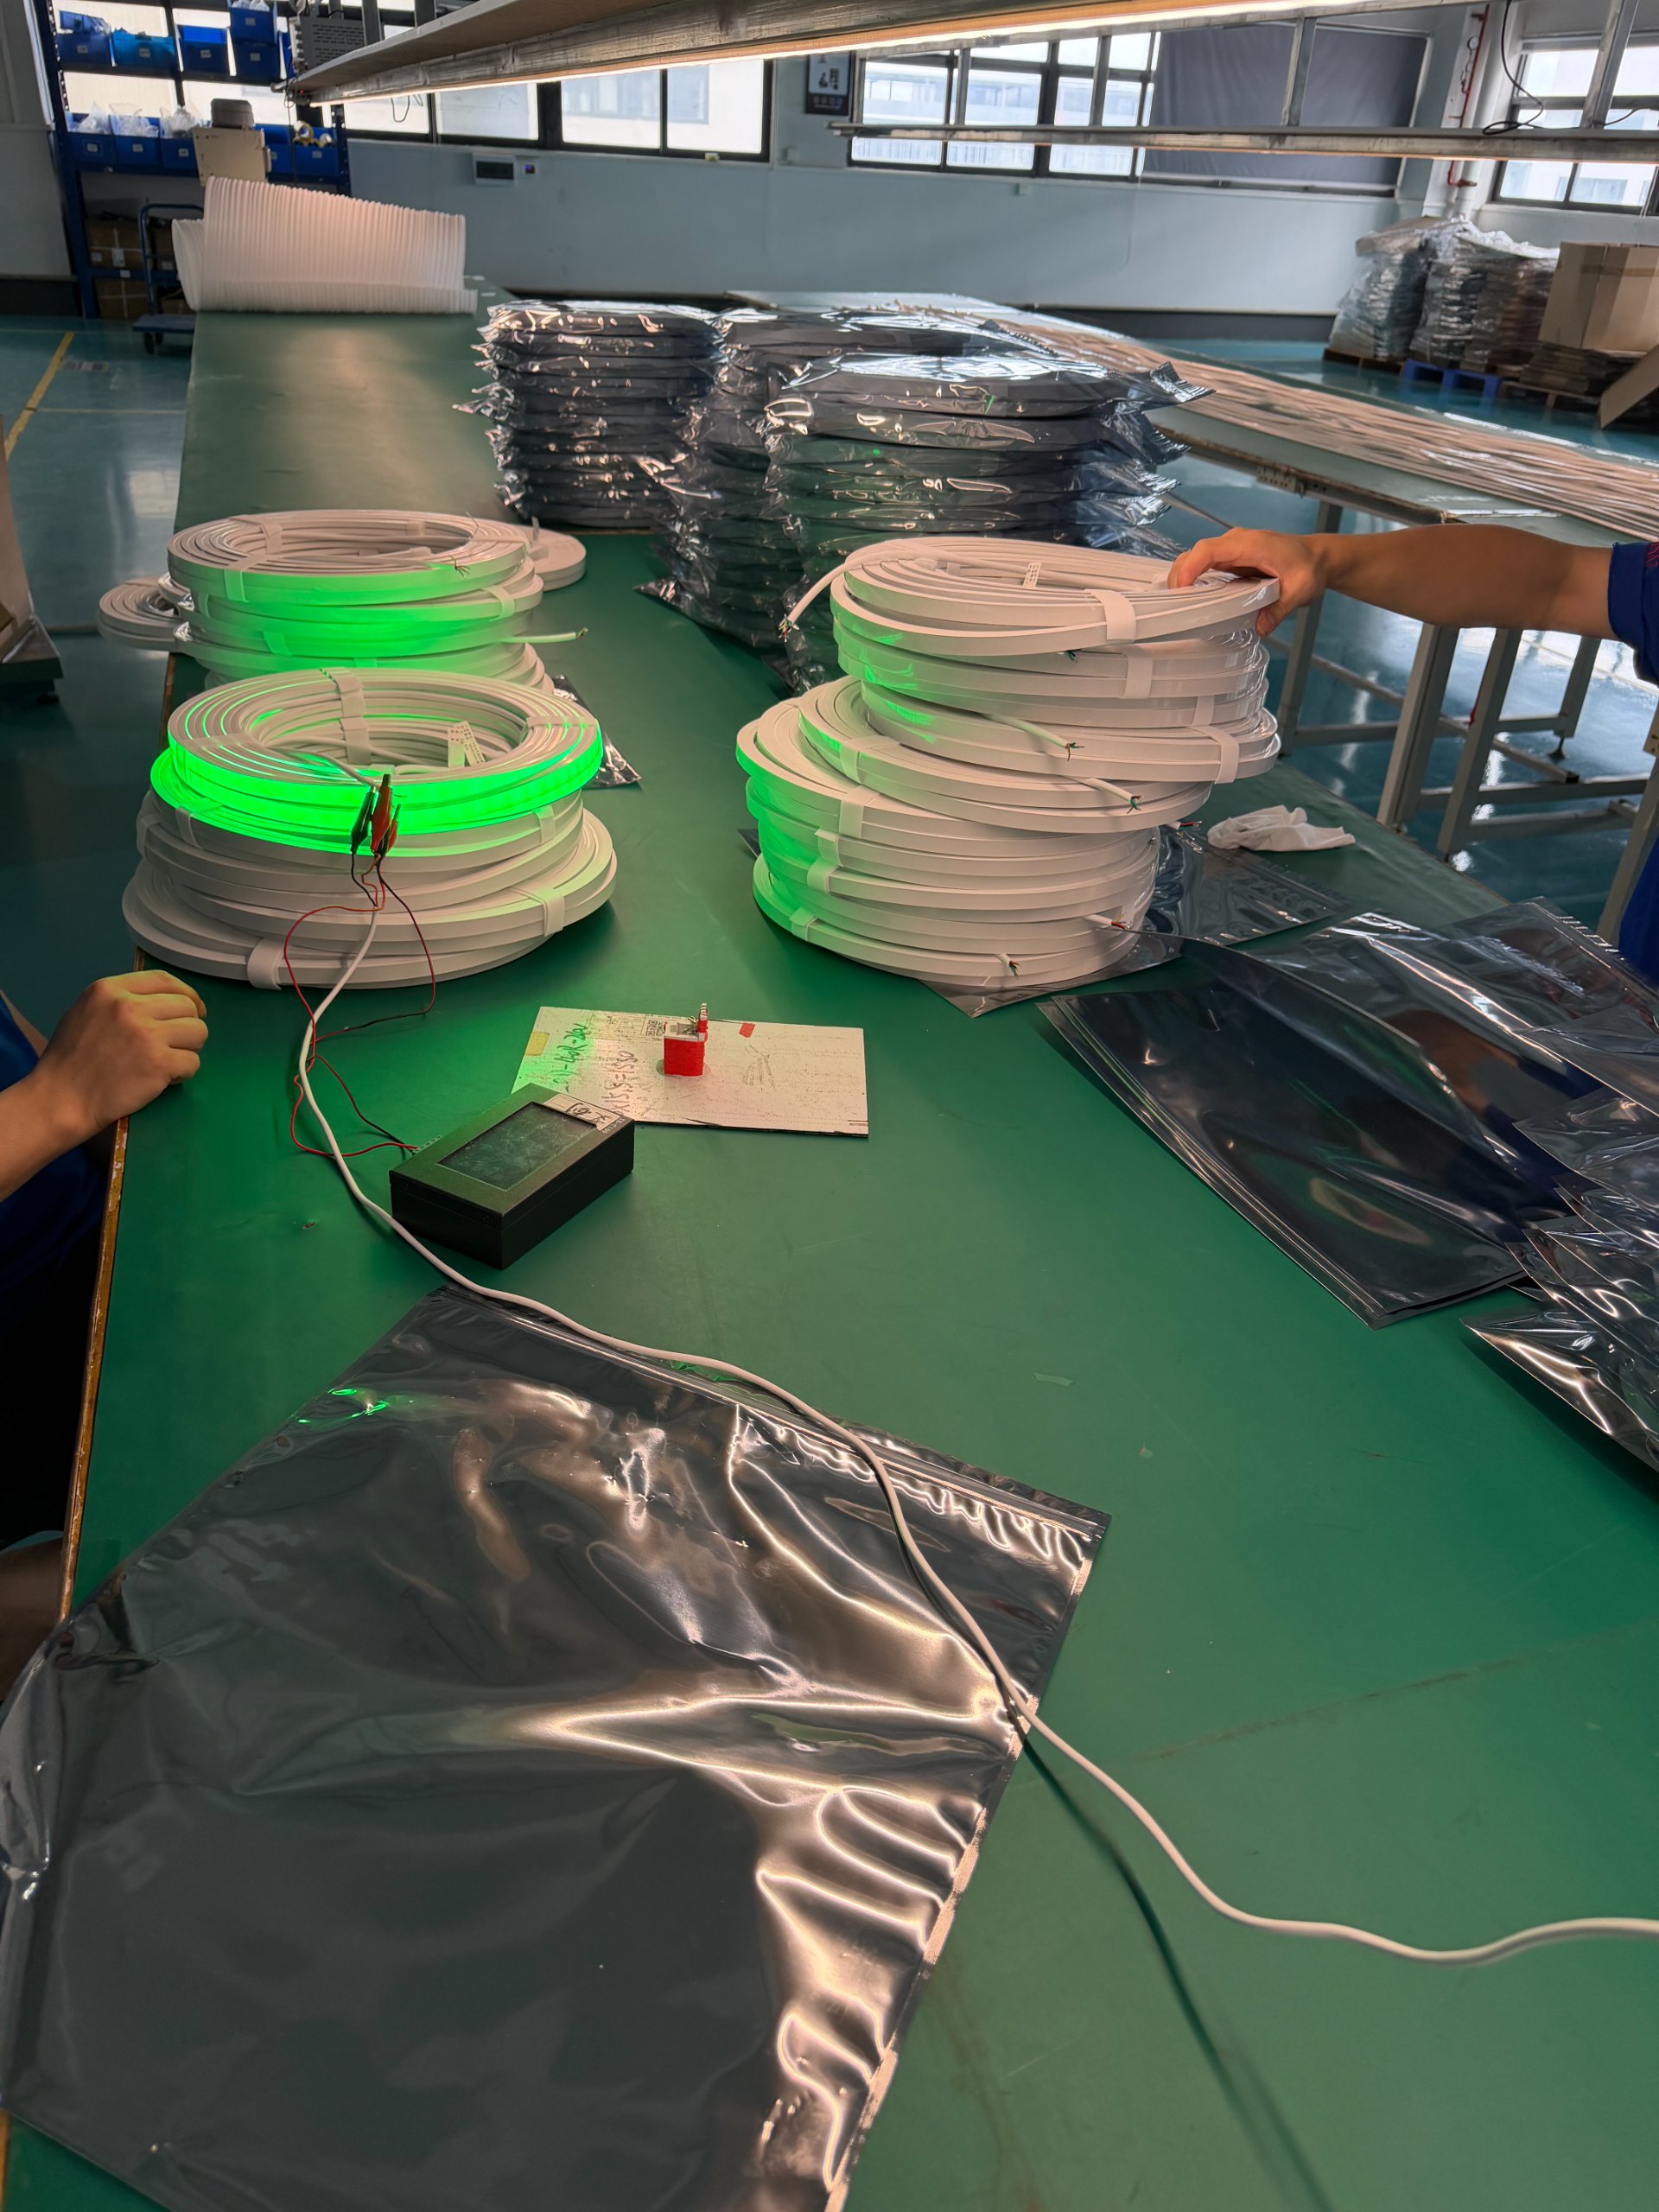
I worked with a commercial complex project three years ago. The design team wanted ultra-slim architectural outline lighting. They requested a custom neon strip with half the standard emission width. Samples looked incredible. Clean lines. Sophisticated appearance. Superior long-distance visual impact. Production proceeded smoothly. Installation completed without issues. The first three months ran perfectly normal.
Summer arrived. Ambient temperatures climbed. We started seeing anomalies. First, some corner sections dimmed. Then scattered dark zones appeared. Color consistency degraded. By the end of year one, systematic failures forced phased removal. Failure analysis revealed the issue wasn't LED quality. The custom structure had broken the thermal equilibrium. To achieve that slimmer profile, we compressed silicone wall thickness. Heat dissipation pathways changed. PCB width decreased. Copper foil cross-section dropped. Heat concentrated. Long-term operation accelerated solder joint fatigue, increased copper stress, and created thermal accumulation. From a sample perspective, the product met all specifications. From an engineering lifespan perspective, the risk was embedded from day one.
Standard products survive because they have been validated through years of field operation. Custom products essentially redefine product boundaries. When you modify emission width, bending direction, cross-section structure, PCB width, power density, silicone thickness, or mounting method, you disrupt the original stress balance. Projects fail not because suppliers lack customization capability. They fail because nobody verifies whether the customized product can still operate reliably for five years.
Why Do Custom Silicone Structures Create Hidden Failure Points?
Silicone selection seems straightforward. Buyers focus on flexibility. They want soft materials for tight bends. They want thin walls for compact installations. They approve samples based on immediate tactile feel and visual effect. But long-term outdoor performance depends on completely different parameters. I have seen dozens of projects with spectacular initial installations turn into maintenance nightmares within 18 months.
Custom silicone structures fail when material hardness doesn't match installation stress patterns. Shore A 60 silicone works for horizontal installations but creeps under vertical hanging loads. Shore A 80 silicone maintains shape but cracks under extreme temperature cycles. Outdoor projects face daily thermal expansion cycles ranging from -40°C to +60°C. After 500 thermal cycles, improperly specified silicone develops microcracks, structural deformation, waterproofing failure, and joint separation.
The most dangerous failures start invisible. Outdoor installations experience summer heat, winter cold, and constant day-night thermal cycling. Materials expand and contract continuously. If silicone hardness is wrong or cross-section design is unbalanced, long-term thermal cycling produces microcracks. These cracks don't leak immediately. They propagate slowly through stress concentration points. Eventually, water ingress occurs. Everyone checks end caps and adhesive joints. Nobody traces the problem back to the cross-section design mistake made months earlier during customization discussions.
I learned this lesson the hard way on a hotel facade project. The client wanted flexible neon strips that could form complex curved patterns along architectural features. We specified Shore A 60 silicone for maximum flexibility. Installation proceeded smoothly. The curves looked perfect. After eight months, we started receiving reports of water damage inside the strips. We inspected end caps. We checked mounting clips. We re-sealed connections. Problems persisted. Finally, we cut open several failed sections. Microcracks had formed throughout the silicone body, especially at stress points where curves changed direction. The soft silicone that enabled those beautiful curves couldn't resist long-term mechanical stress. We should have used zoned hardness specifications: softer material in neutral stress zones, harder material at mounting points and directional transitions.
| Installation Type | Recommended Hardness | Critical Failure Mode |
|---|---|---|
| Horizontal Surface Mount | Shore A 60-70 | UV degradation, surface chalking |
| Vertical Hanging | Shore A 75-85 | Creep deformation, sagging |
| Large Span Suspension | Shore A 80-90 | Fatigue cracking at support points |
| Curved Surface Mounting | Shore A 70-80 | Stress concentration at bend points |
| Underwater Applications | Shore A 75-85 | Hydrolysis, plasticizer loss |
The fundamental issue is that there is no universal silicone formula. Each installation method creates different stress patterns. Each environment imposes different aging mechanisms. Professional customization means mapping stress distribution first, then selecting material properties to match actual loading conditions. Amateur customization means choosing the softest silicone that allows tight bends, then hoping nothing fails.
How Does Custom Bending Radius Affect Long-Term PCB Reliability?
Everyone wants tighter bends. Designers show renderings with complex curves wrapping around architectural details. They ask for minimum bending radius. Suppliers demonstrate flexibility by bending samples into circles. Orders get placed based on these demonstrations. I have watched this cycle repeat dozens of times. What nobody discusses during sample evaluation is fatigue life.
PCB bending creates permanent stress in copper traces and solder joints. Radius below design limits puts traces into plastic deformation zone. Short-term testing shows electrical continuity. Long-term operation reveals progressive fatigue failure. Dark zones in custom neon installations typically result not from LED failure, but from copper trace cracking or solder joint separation after 500-1000 thermal cycles at stressed bend points.
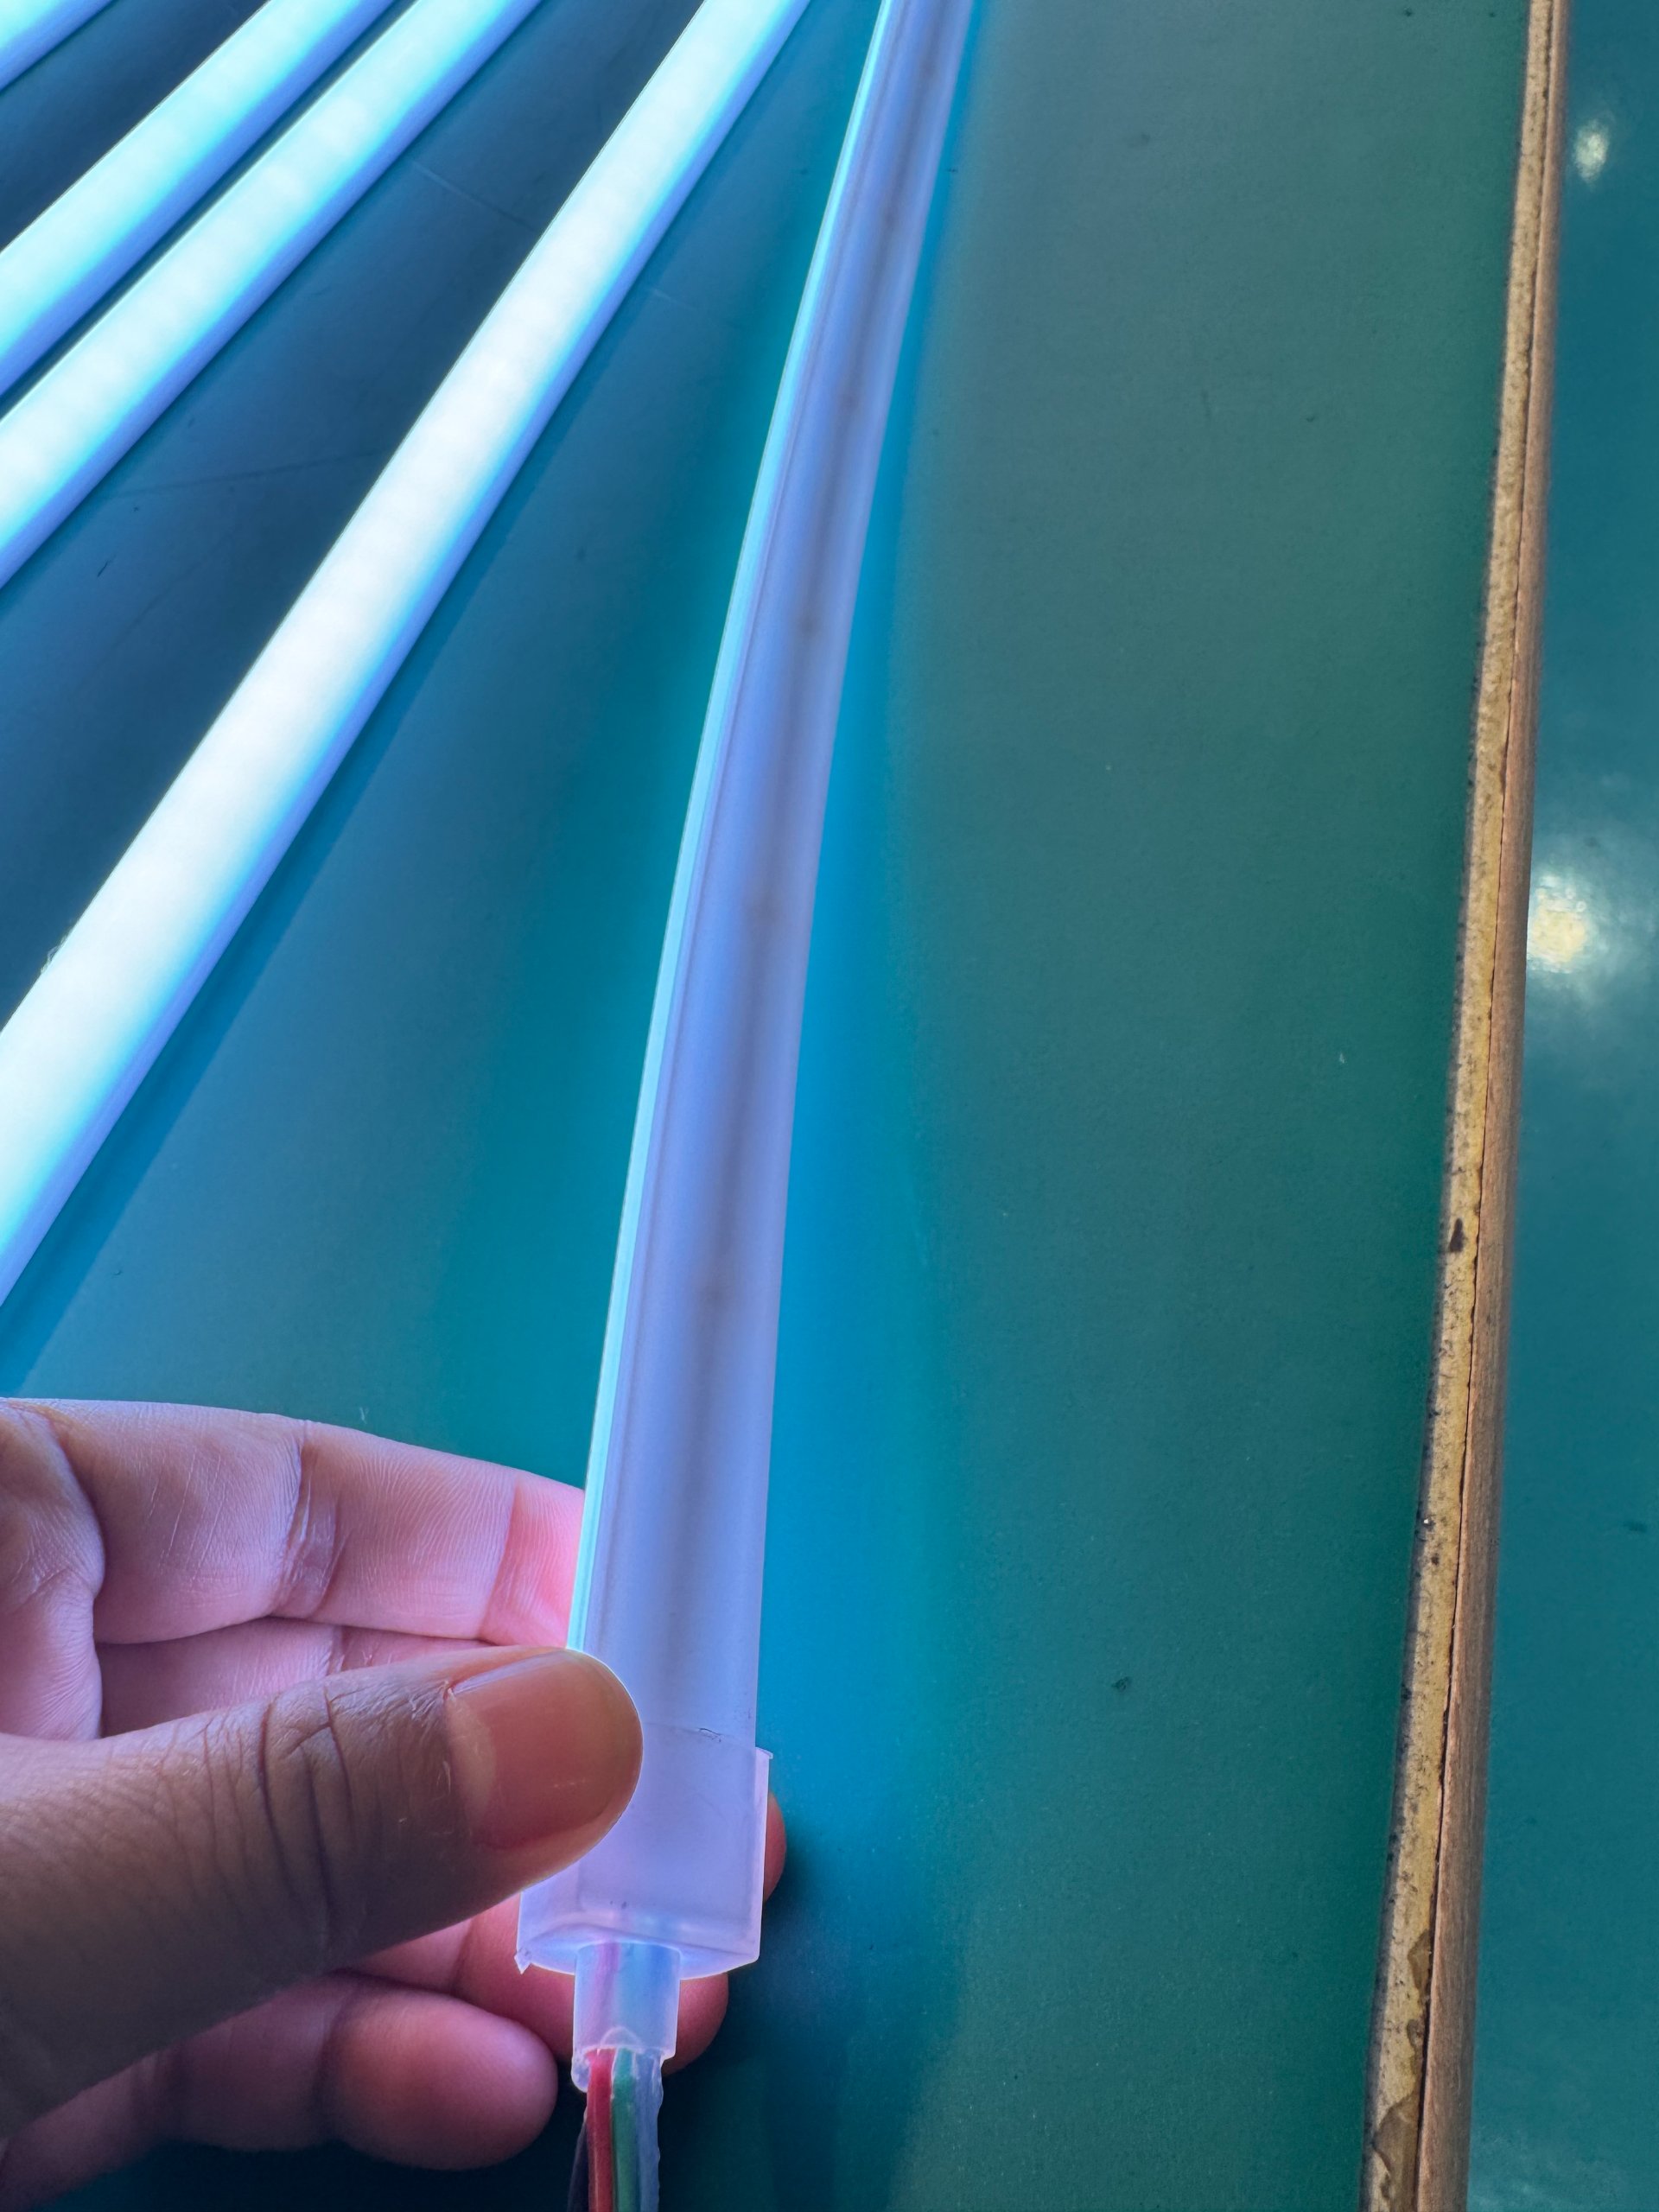
Most LED failures are obvious. A chip burns out. Light output stops. But mechanical fatigue creates intermittent failures. A crack propagates through a copper trace. Contact resistance increases. Local heating intensifies. The crack grows larger. Eventually, the circuit opens completely. This process takes months. By the time you notice dark zones, the damage has spread to adjacent sections. Repairing these failures is nearly impossible because the root cause is structural, not electrical.
I evaluated a commercial signage project last year. The design required 20mm bending radius throughout the installation. Our standard product specifies 50mm minimum radius. The client insisted the tight bends were essential for their logo design. We ran electrical tests on prototypes. All passed. We ran thermal cycling tests. No immediate failures appeared. We approved production. Six months after installation, scattered dark zones began appearing at bend points. We retrieved failed sections for analysis. Copper traces showed classic fatigue cracking. Solder joints exhibited thermal fatigue damage. The bends hadn't failed during testing because standard accelerated tests only run 100-200 cycles. Real installations face 2-3 thermal cycles daily. After 500 real-world cycles, the accumulated stress exceeded material endurance limits.
The correct approach requires finite element analysis of stress distribution at proposed bend radius. You need to calculate strain in copper traces, stress concentration at solder joints, and fatigue life under cyclic loading. Then you either modify the design to reduce stress, or you modify the PCB structure to increase fatigue resistance. Simply proving that a prototype can bend doesn't prove it will survive five years of thermal cycling at that bend radius.
Why Do UV Resistance Tests Miss Real-World Degradation Mechanisms?
Every outdoor LED neon strip claims UV resistance. Suppliers provide test reports showing hundreds or thousands of hours of UV exposure without yellowing. Buyers see these reports and assume outdoor performance is guaranteed. I have learned that laboratory UV testing and real-world UV aging are completely different phenomena. Standard tests use accelerated conditions that don't replicate the synergistic effects of UV, temperature, moisture, and atmospheric pollutants acting simultaneously.
Real outdoor environments combine UV radiation with thermal cycling, rain, humidity, and airborne contaminants. These factors interact synergistically to accelerate silicone degradation. A silicone compound that passes 1000 hours of isolated UV testing may fail within 18 months of actual outdoor exposure. Professional validation requires weathering tests that simulate combined environmental stresses, measuring not just yellowing, but also light transmission loss, tensile strength degradation, surface chalking, and plasticizer migration.
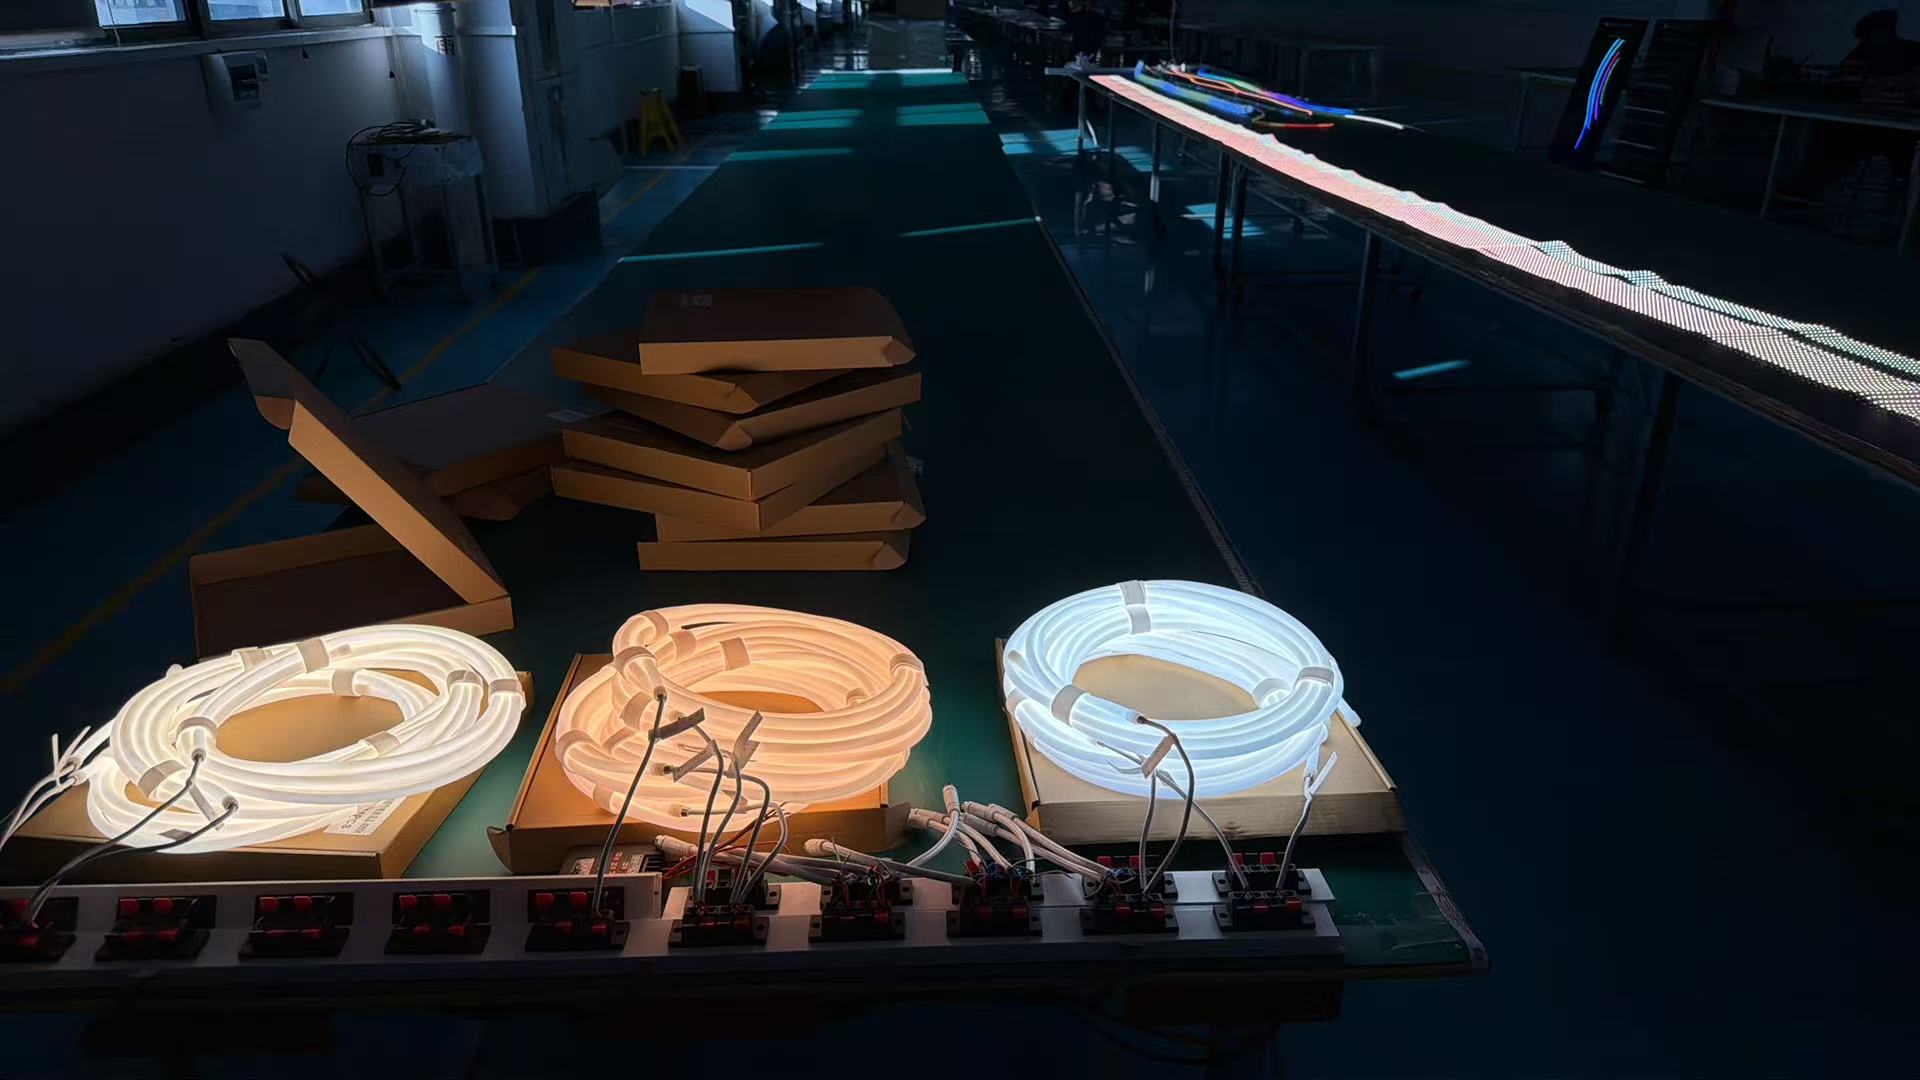
I worked with a city landscape lighting project that specified custom white-emitting neon strips for park pathways. The supplier provided UV test reports showing no yellowing after 2000 hours. The silicone compound met all stated specifications. Installation covered several kilometers of pathway lighting. The first year looked perfect. Year two brought visible color shift. White emission took on a yellow tint. Year three showed pronounced yellowing and reduced light output. We analyzed degraded samples. The silicone had experienced photo-oxidation—a process where UV breaks down polymer chains in the presence of oxygen. Laboratory UV tests ran in controlled atmospheres without the oxygen exposure that outdoor installations face continuously. The test proved UV stability in isolation. It didn't prove real-world weathering resistance.
Professional outdoor validation requires ASTM G154 weathering tests or equivalent protocols. These tests cycle between UV exposure, moisture condensation, and thermal shock. They measure multiple degradation parameters: yellowing index (ASTM E313), light transmission change (ASTM D1003), tensile strength retention (ASTM D412), and surface hardness change (ASTM D2240). A compound that maintains less than 5% transmission loss and less than 20% tensile strength degradation after 2000 hours of accelerated weathering has proven outdoor durability. A compound that simply doesn't yellow under UV lamps has proven nothing about outdoor service life.
| Test Parameter | Standard Method | Acceptance Criteria | Failure Indicator |
|---|---|---|---|
| Yellowing Index | ASTM E313 | ΔE < 3 after 2000h | ΔE > 5 indicates significant degradation |
| Light Transmission | ASTM D1003 | < 5% loss after 2000h | > 10% loss affects brightness |
| Tensile Strength | ASTM D412 | < 20% loss after 2000h | > 30% loss indicates structural failure risk |
| Surface Chalking | Visual inspection | No visible chalking | Chalking indicates polymer breakdown |
| Hardness Change | ASTM D2240 | < 5 Shore points | > 10 points indicates plasticizer loss |
The gap between laboratory testing and field performance is where custom projects most frequently fail. Standard products have years of installed base to validate real-world behavior. Custom formulations have only laboratory predictions. Professional suppliers bridge this gap with accelerated weathering protocols that actually predict outdoor performance. Amateur suppliers provide UV test reports that predict nothing.
When Does Supply Chain Consistency Become Critical for Custom Projects?
Sample approval seems like the end of technical validation. Buyers receive samples, test them, approve quality, and place production orders. For standard products with established supply chains, this process works reliably. For custom products, it often leads to a silent disaster: batch-to-batch variation. The samples you tested and the production you receive may share a specification sheet but differ significantly in actual performance characteristics.
Custom LED neon strips depend on precise material combinations: LED binning, silicone formulation, optical diffusion additives, and PCB specifications. Each component has acceptable variation ranges. When you combine four components, each with ±5% tolerance, total system variation can reach ±20%. For architectural installations requiring color consistency across thousands of meters, this variation is catastrophic. Professional customization requires locked supply chain specifications with zero substitution tolerance.
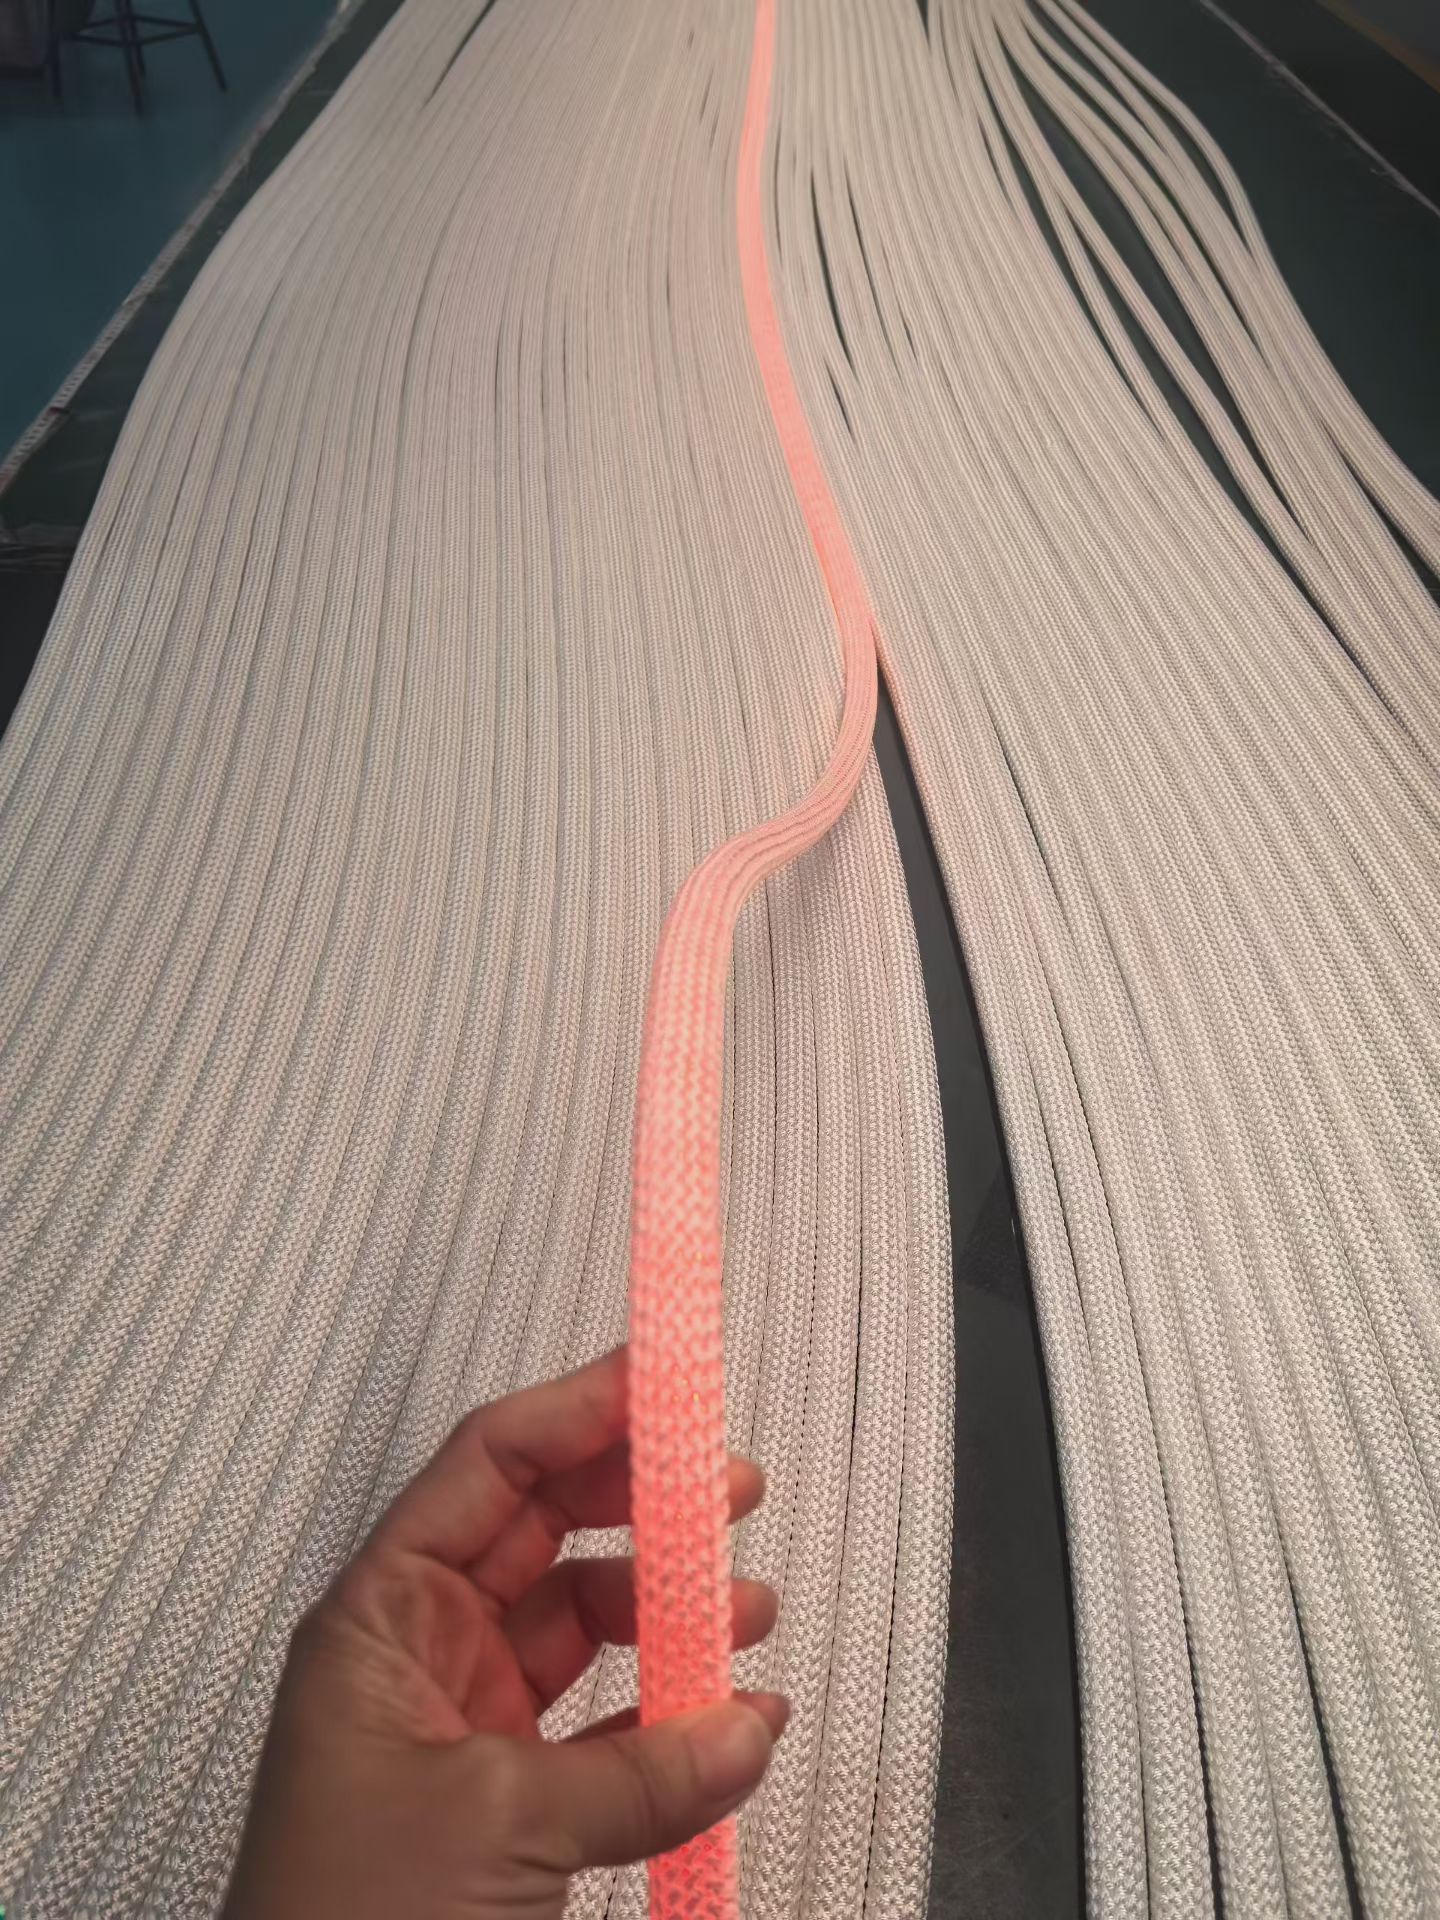
I encountered this problem on a hotel renovation project. The design specified custom warm white LED neon strips at 2700K color temperature for corridors spanning multiple floors. We approved samples with excellent color consistency. Production and installation proceeded floor by floor over three months. By the time the project completed, we had three distinct color zones. The first installation batch matched samples perfectly. The second batch showed slight yellow shift. The third batch had noticeable color difference compared to the first. All batches measured within the specified 2700K ± 150K tolerance. But human eyes perceive even 100K differences when sections are installed adjacent to each other.
The root cause was LED bin substitution. Our initial samples used LED chips from a specific bin with tight color coordinates. During production, that bin depleted. The manufacturer substituted another bin within the same 2700K category but with different color point coordinates. Both bins met specifications. Neither was wrong. But they were visibly different when installed side by side. Professional custom suppliers lock not just color temperature category, but specific LED bin coordinates: x, y chromaticity values and luminous flux range. Amateur suppliers lock only CCT value, then wonder why customers complain about color matching issues.
The same problem occurs with silicone formulations. Small changes in catalyst ratio, curing conditions, or base polymer affect light transmission and optical diffusion characteristics. PCB copper thickness variations affect thermal performance and electrical resistance. Each change stays within specification limits but shifts system behavior. For projects requiring hundreds or thousands of meters of consistent product, these small shifts accumulate into visible problems.
We now specify locked supply chain protocols for all custom projects:
- LED chips: specific bin codes with ±2 SDCM color consistency
- Silicone: locked batch formula with lot-traceable raw materials
- PCB: fixed copper weight and surface finish from single supplier
- Optical diffusion: controlled particle size distribution and loading percentage
These controls add complexity and cost. They also eliminate the batch variation that destroys architectural lighting projects. You cannot achieve visual consistency across large installations without supply chain discipline.
Conclusion
Custom LED neon strips fail not from inability to manufacture, but from failure to re-validate reliability after modification. Professional suppliers engineer complete systems, not just modified dimensions. They predict failure modes before they occur, then redesign to eliminate risks. True customization capability means transforming concepts into long-term stable engineering systems.